


 45 / 48

VOLUME 12 NUMBER 2 • NOVEMBER 2015
87
SA JOURNAL OF DIABETES & VASCULAR DISEASE
RESEARCH ARTICLE
LV geometry in diabetic populations from sub-Saharan Africa.
Therefore, the present study is among the few to report on
prevalence and covariates of abnormal LV geometry in diabetic sub-
Saharan African patients.
The study has many interesting findings, adding to current
knowledge on diabetic heart disease in Africans, in particular (1)
that abnormal LV geometry is common in sub-Saharan African
diabetic patients, (2) that concentric remodelling was the most
prevalent abnormal LV geometric pattern in this population and
associated with reduced LV myocardial contractility and delayed
diastolic relaxation, and (3) that a simple algorithm combining
everyday clinical and laboratory assessment may be used to identify
diabetic patients with high risk of cardiac target-organ damage.
Our findings add to a previous report by Ojji
et al
. on Nigerians
with type 2 diabetes.
21
In their study of 122 patients, abnormal
LV geometry was found in 51% of patients, compared to 74% in
the present study. Of note, the study by Ojji
et al
.
21
only included
normotensive type 2 diabetes patients, and as demonstrated
by our findings, hypertension was a strong covariate of having
both LV hypertrophy and increased RWT, probably explaining the
higher prevalence of abnormal LV geometry in the present study.
As demonstrated, age and systolic blood pressure were the main
confounders explaining the difference in LV structure between
groups of patients with type 1 or type 2 diabetes.
Hypertension, in particular isolated systolic hypertension,
increases in prevalence with aging, mainly as a consequence of
arterial stiffening imposing increased load on the left ventricle.
Older age has been documented to be particularly associated
with increased RWT, and with LV hypertrophy when hypertension
coexists.
22-24
However, despite differences in socio-demographic
backgrounds, our results were comparable to those reported by
Eguchi
et al
. from Japanese hypertensive patients with type 2
diabetes. In their study, including 161 patients, the prevalence
of concentric remodelling, eccentric hypertrophy and concentric
hypertrophy, respectively, were 29, 16 and 39%.
25
We found no previous echocardiographic study on LV geometric
patterns performed among type 1 diabetes patients from sub-
Saharan Africa, and our study is probably the first to describe
LV geometry in such patients. As demonstrated by our results,
abnormal LV geometry was found in 40% of type 1 diabetes
patients. Specifically, 30%of type 1 diabetes patients had concentric
remodelling, and this was the most common type of abnormal LV
geometry in this group. All six type 1 diabetes patients (10%) with
LV hypertrophy had eccentric LV hypertrophy.
Interestingly, none of the type 1 diabetes patients had concentric
LV hypertrophy, the most common abnormal LV geometric pattern
found among type 2 diabetes patients in the present study. This
finding could probably be explained by the low prevalence of
hypertension among type 1 diabetes patients in our study (18 vs
82%). Other investigators have reported a higher prevalence of LV
hypertrophy among type 1 diabetes patients with nephropathy.
26
Of note, in the present study population, all type 1 diabetes
patients with LV hypertrophy also had albuminuria (results not
shown), and albuminuria was identified as a main covariate of
LV hypertrophy in multivariate analysis. The beneficial impact of
renin–angiotensin inhibition on albuminuria and the prevention
of overt renal failure has previously been demonstrated in type 1
diabetes patients with microalbuminuria.
27
Whether the prevention
of progression to overt renal failure with the use of drugs that
inhibit the renin–angiotensin system will also prevent progression
to LV hypertrophy among type 1 diabetes patients is a question that
needs to be answered in future prospective studies in Africans.
The finding that higher RWT was significantly associated with
older age and higher blood pressure agree with previous reports
from epidemiological studies in North American Indians.
3
Importantly
though, as demonstrated by multivariate analysis in our study,
independent associations between increased RWT and measures of
systolic and diastolic LV function were found irrespective of presence
or absence of LV hypertrophy or hypertension. This is an important
finding because it emphasises the need to further stratify patients
into the different LV geometric patterns, rather than by presence or
absence of LV hypertrophy alone. The finding is particularly important
in the African diabetes context, as concentric remodelling (increased
RWT with normal LVMI) was found to be the most common abnormal
LV geometric pattern in the present study, as also previously reported
among African American hypertensive patients.
4
Table 5.
Independent covariates of higher RWT in total population and type 1 and type 2 diabetes patients
Total population (R2 = 0.69*)
Type 1 (R2 = 0.73*)
Type 2 (R2 = 0.66*)
Covariate
b
p
-value
b
p
-value
b
p
-value
Systolic blood pressure (mmHg)
0.301
< 0.001
0.442
< 0.001
0.233
0.001
Low eGFR (ml/min/1.73 m
2
)
0.131
0.007
0.009
0.909
0.150
0.024
Low stress-corrected MWS (%)
0.239
< 0.001
0.493
< 0.001
0.156
0.017
Isovolumic relaxation time (ms)
0.170
0.001
0.180
0.041
0.155
0.016
LV mass/height
2.7
0.187
0.001
0.091
0.284
0.189
0.008
Circumferential end-systolic stress (dyne/cm
2
)
–0.584
< 0.001
–0.682
< 0.001
–0.602
< 0.001
Male gender
0.083
0.065
–0.009
0.905
0.123
0.051
eGFR = estimated glomerular filtration rate, MWS = midwall shortening, *
p
< 0.001.
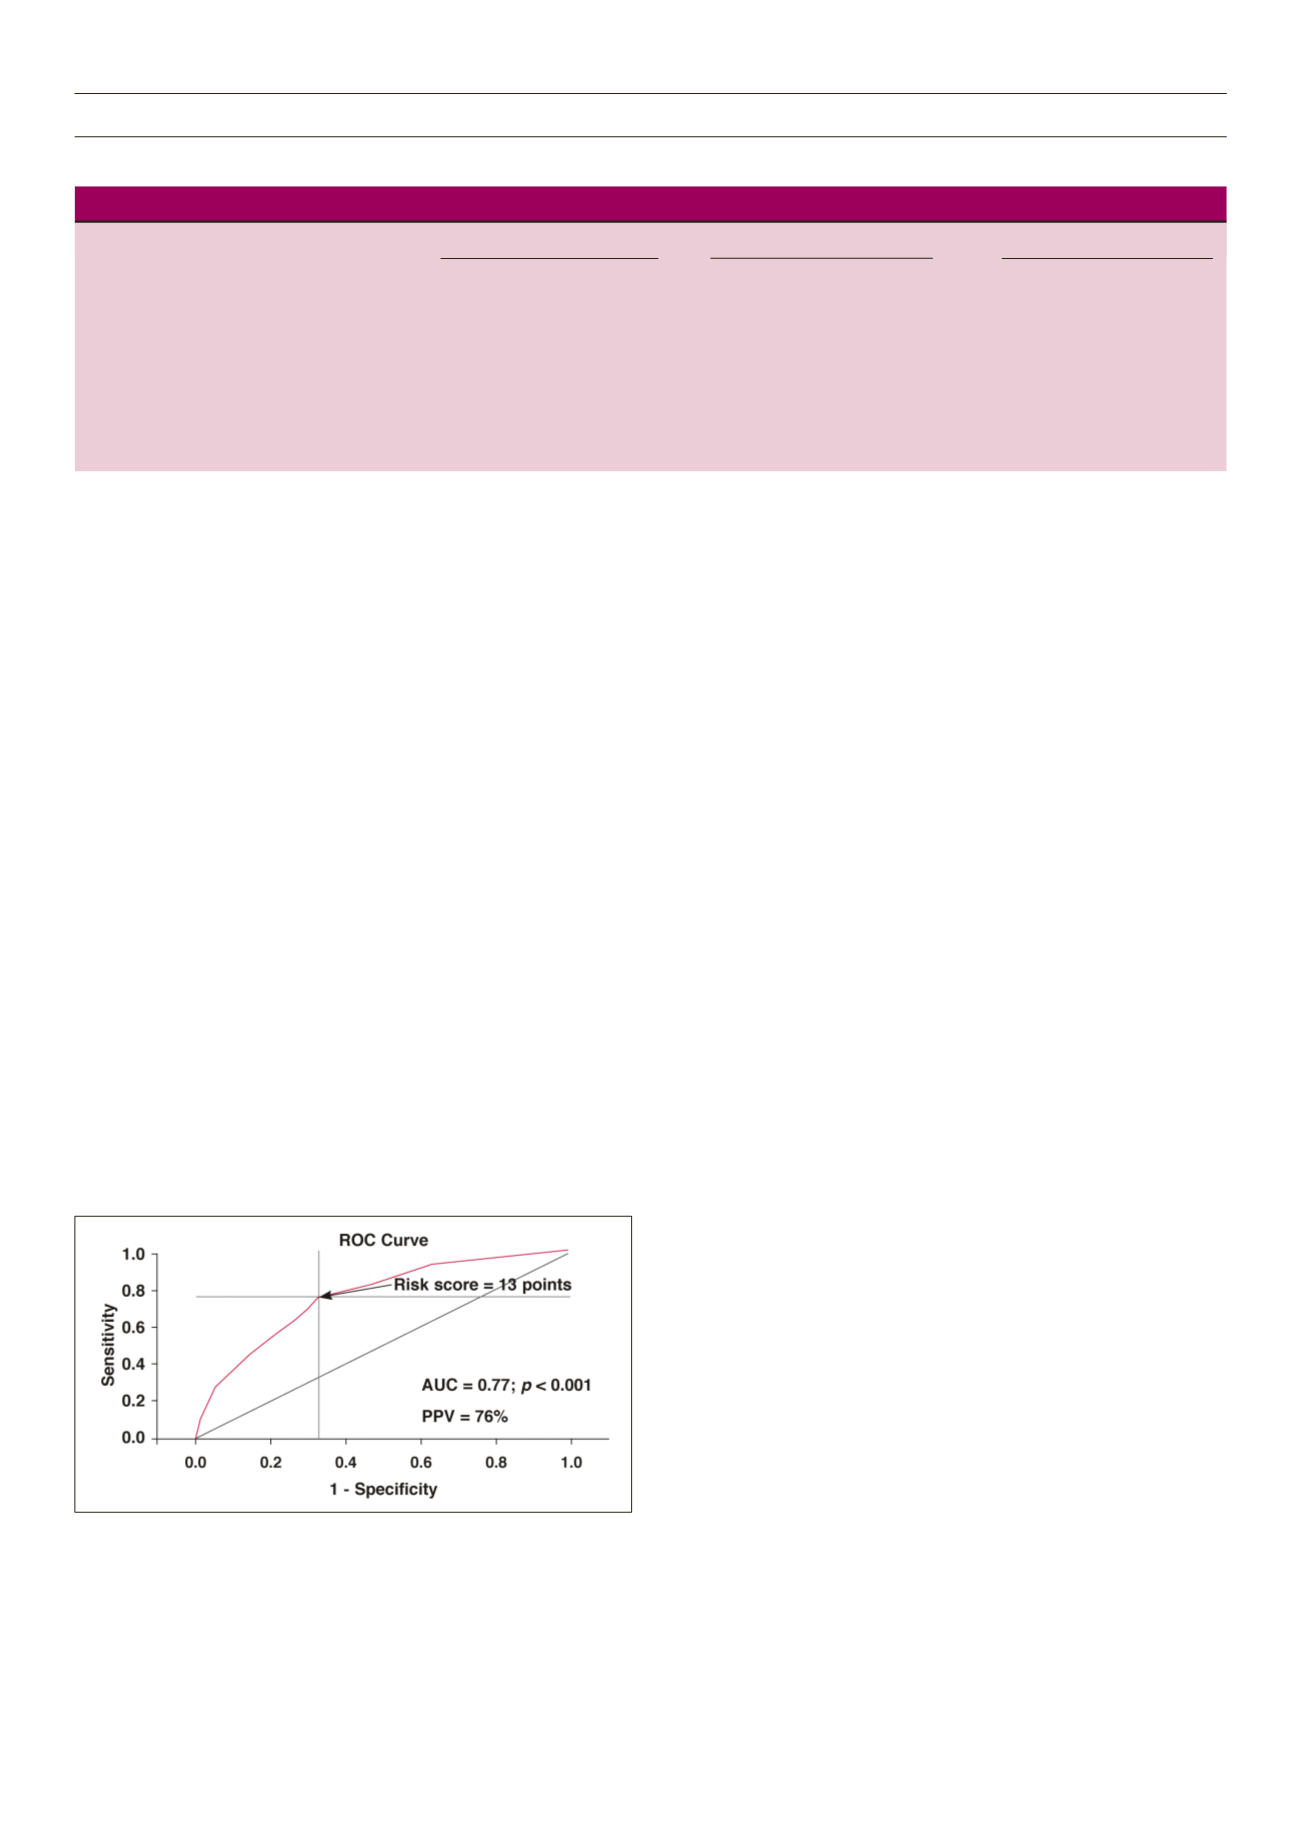
Figure 4.
Receiver-operator characteristic (ROC) curve for the clinical risk score
with best sensitivity (76%) and specificity (67%) in predicting high relative wall
thickness. The cut-off value for the risk score (13 points) identified by the ROC
analysis is indicated by an arrow. AUC = area under the curve, PPV = positive
predictive value.