


 44 / 48

86
VOLUME 12 NUMBER 2 • NOVEMBER 2015
RESEARCH ARTICLE
SA JOURNAL OF DIABETES & VASCULAR DISEASE
with impaired systolic and diastolic LV function, including lower
myocardial contractility, measured as scMWS, and delayed early LV
diastolic relaxation, measured as longer IVRT, longer deceleration
time and reduced E/A ratio, both in type 1 and type 2 diabetes
patients (all
p
< 0.05) (Table 4).
When multivariate linear regression analyses were performed,
higher systolic blood pressure, longer IVRT and low scMWS remained
significant covariates of higher RWT both in type 1 and type 2 diabetes
patients, irrespective of presence or absence of LV hypertrophy and
also adjusted for CESS. In addition, low eGFR continued to be an
independent covariate of higher RWT in type 2 diabetes patients.
Substituting log UACR for eGFR in the type 1 diabetes patients’
model did not give any independent association either (Table 5).
In binary logistic regression analysis, including type of diabetes,
albuminuria, obesity, history of hypertension and HbA
1c
level,
the independent covariates of increased RWT were: type 2
diabetes (OR 2.7, 95%CI: 1.08–7.00), albuminuria (OR 2.2, 95%CI:
1.01–4.62), obesity (OR 2.6, 95% CI: 1.02–6.58) and hypertension
(OR 2.5, 95% CI: 1.02–5.87), all
p
< 0.05.
A risk score was calculated based on the beta coefficients in this
model: risk score = 9x (type of diabetes) + 8x (albuminuria) + 9x
(obesity) + 9x (hypertension). For each parameter included in the
score, a value of 1 was assigned if the variable was present or 0 if
it was absent. Therefore the individual risk score varied in this study
population between 0 and 35 points. Based on the ROC curve
analysis, the optimal cut-off point for the prediction of increased
RWT was a score of 13 points (area under the curve = 0.77,
p
<
0.001, sensitivity = 76% and specificity = 67%). This risk score had
a positive predictive value of 76% (Fig. 4).
Discussion
From echocardiographic studies in Caucasians, North American
Indians and African Americans, it is well known that diabetes is
associated with concentric LV remodelling, and LV hypertrophy is
particularly common in patients with combined type 2 diabetes
and hypertension.
19,20
However, few studies have reported on
Table 4.
Correlates of RWT in the total population and in type 1 and type 2 diabetes patients
Total population
Type 1
Type 2
r
p
-value
r
p
-value
r
p
-value
Age (years)
0.391
< 0.001
0.357
0.005
0.203
0.035
Body mass index (kg/m
2
)
0.237
0.002
0.068
0.605
0.031
0.752
Systolic blood pressure (mmHg)
0.383
< 0.001
0.359
0.004
0.234
0.015
Diastolic blood pressure (mmHg)
0.388
< 0.001
0.331
0.009
0.282
0.003
Fasting blood glucose (mmol/l)
0.029
0.705
0.204
0.118
0.068
0.485
HbA
1c
(%)
–0.009
0.909
0.113
0.390
0.066
0.496
eGFR (ml/min/1.73 m
2
)
–0.282
< 0.001
–0.076
0.563
–0.319
0.001
HDL cholesterol (mmol/l)
–0.165
0.033
–0.146
0.265
–0.277
0.002
Triglycerides (mmol/l)
0.134
0.082
0.279
0.031
0.079
0.416
Triglyceride-to-HDL cholesterol ratio
0.108
0.163
0.141
0.287
0.175
0.069
Log UACR (mg/g)
0.147
0.059
0.259
0.048
0.194
0.045
E’ (cm/sec)
–0.434
< 0.001
–0.149
0.246
–0.377
< 0.001
LV mass/height
2.7
(g/m
2.7
)
0.477
< 0.001
0.113
0.389
0.426
< 0.001
E/A ratio
–0.382
< 0.001
–0.321
0.012
–0.241
0.012
Deceleration time (ms)
0.313
< 0.001
0.255
0.047
0.228
0.017
Isovolumic relaxation time (ms)
0.428
< 0.001
0.304
0.017
0.347
< 0.001
Circumferential end-systolic stress (dyne/cm
2
)
–0.421
< 0.001
–0.349
0.006
–0.557
< 0.001
Midwall shortening (%)
–0.717
< 0.001
–0.619
< 0.001
–0.723
< 0.001
Stress-corrected midwall shortening (%)
–0.755
< 0.001
–0.675
< 0.001
–0.759
< 0.001
E/E’
0.299
< 0.001
–0.158
0.228
0.293
0.002
HbA
1c
= glycated haemoglobin, eGFR = estimated glomerular filtration rate, HDL = high-density lipoprotein, UACR = urine albumin creatinine ratio.
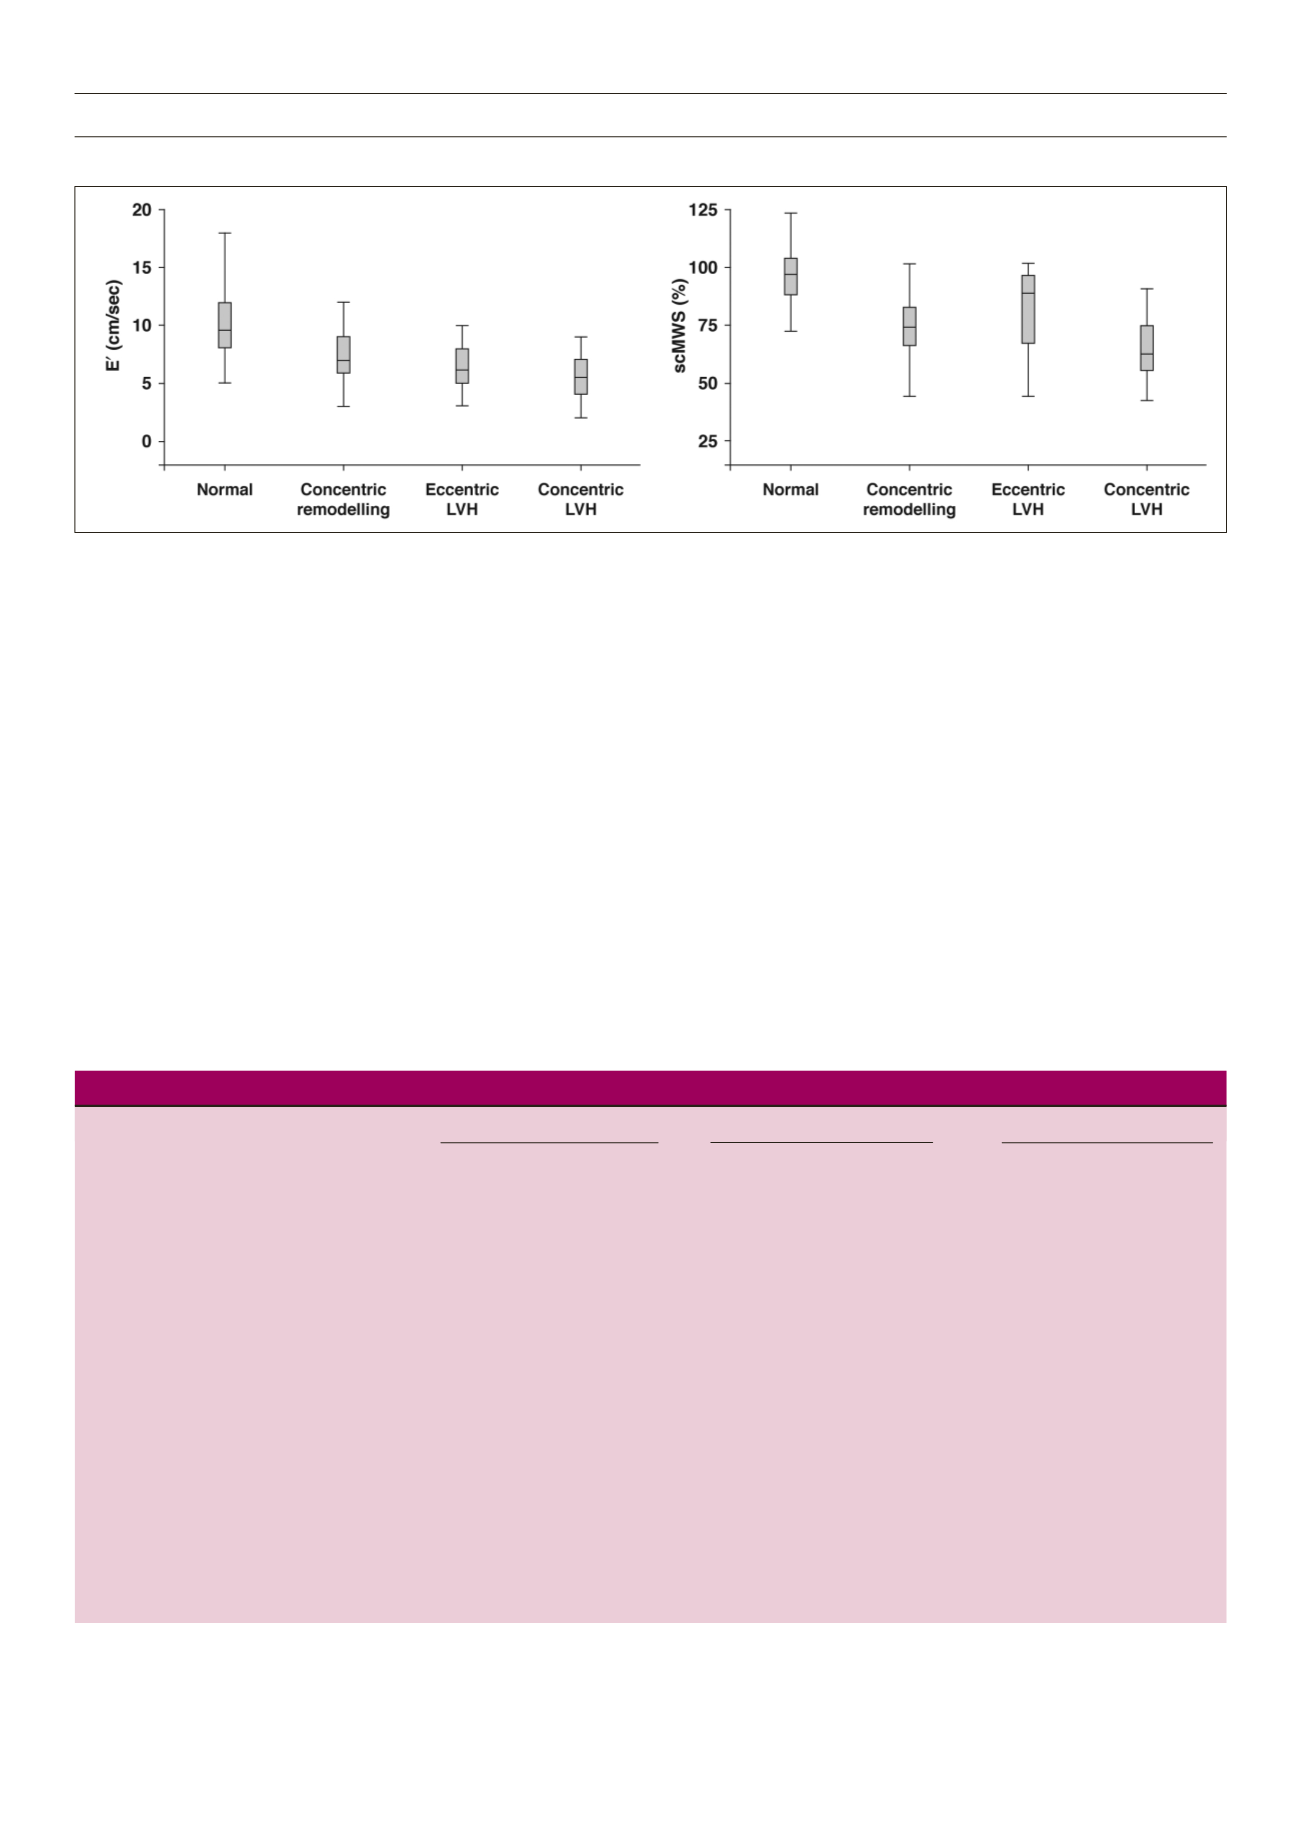
Figure 3
. Early tissue Doppler velocity (E’) and stress-corrected midwall shortening (scMWS) in relation to LV geometric patterns;
p
< 0.001 for comparison of E’ (left
panel) and scMWS (right panel) in the four geometric patterns by ANOVA.