


 43 / 48

VOLUME 12 NUMBER 2 • NOVEMBER 2015
85
SA JOURNAL OF DIABETES & VASCULAR DISEASE
RESEARCH ARTICLE
Compared to type 1 diabetes patients, type 2 patients had
larger LV dimensions and higher RWT and LVMI (Table 2). LV
systolic chamber function measured as stress-corrected fractional
shortening and ejection fraction did not differ between the two
groups, while myocardial contractility assessed by stresscorrected
midwall shortening was significantly lower among type 2 diabetes
patients (Table 2). Measures of diastolic function were also
significantly unfavourable in the type 2 diabetes patients (Table 2).
However, LV dimension and function did not differ between the
two types of diabetes when adjustment for age and systolic blood
pressure was done (Table 2).
In the total population, the prevalence of concentric remodelling,
eccentric hypertrophy and concentric hypertrophy was 32, 8.3 and
23.7%, respectively. LV geometry differed significantly between type
1 and type 2 diabetes patients as a consequence of more type 2
diabetes patients having concentric LV hypertrophy (Fig. 1). Systolic
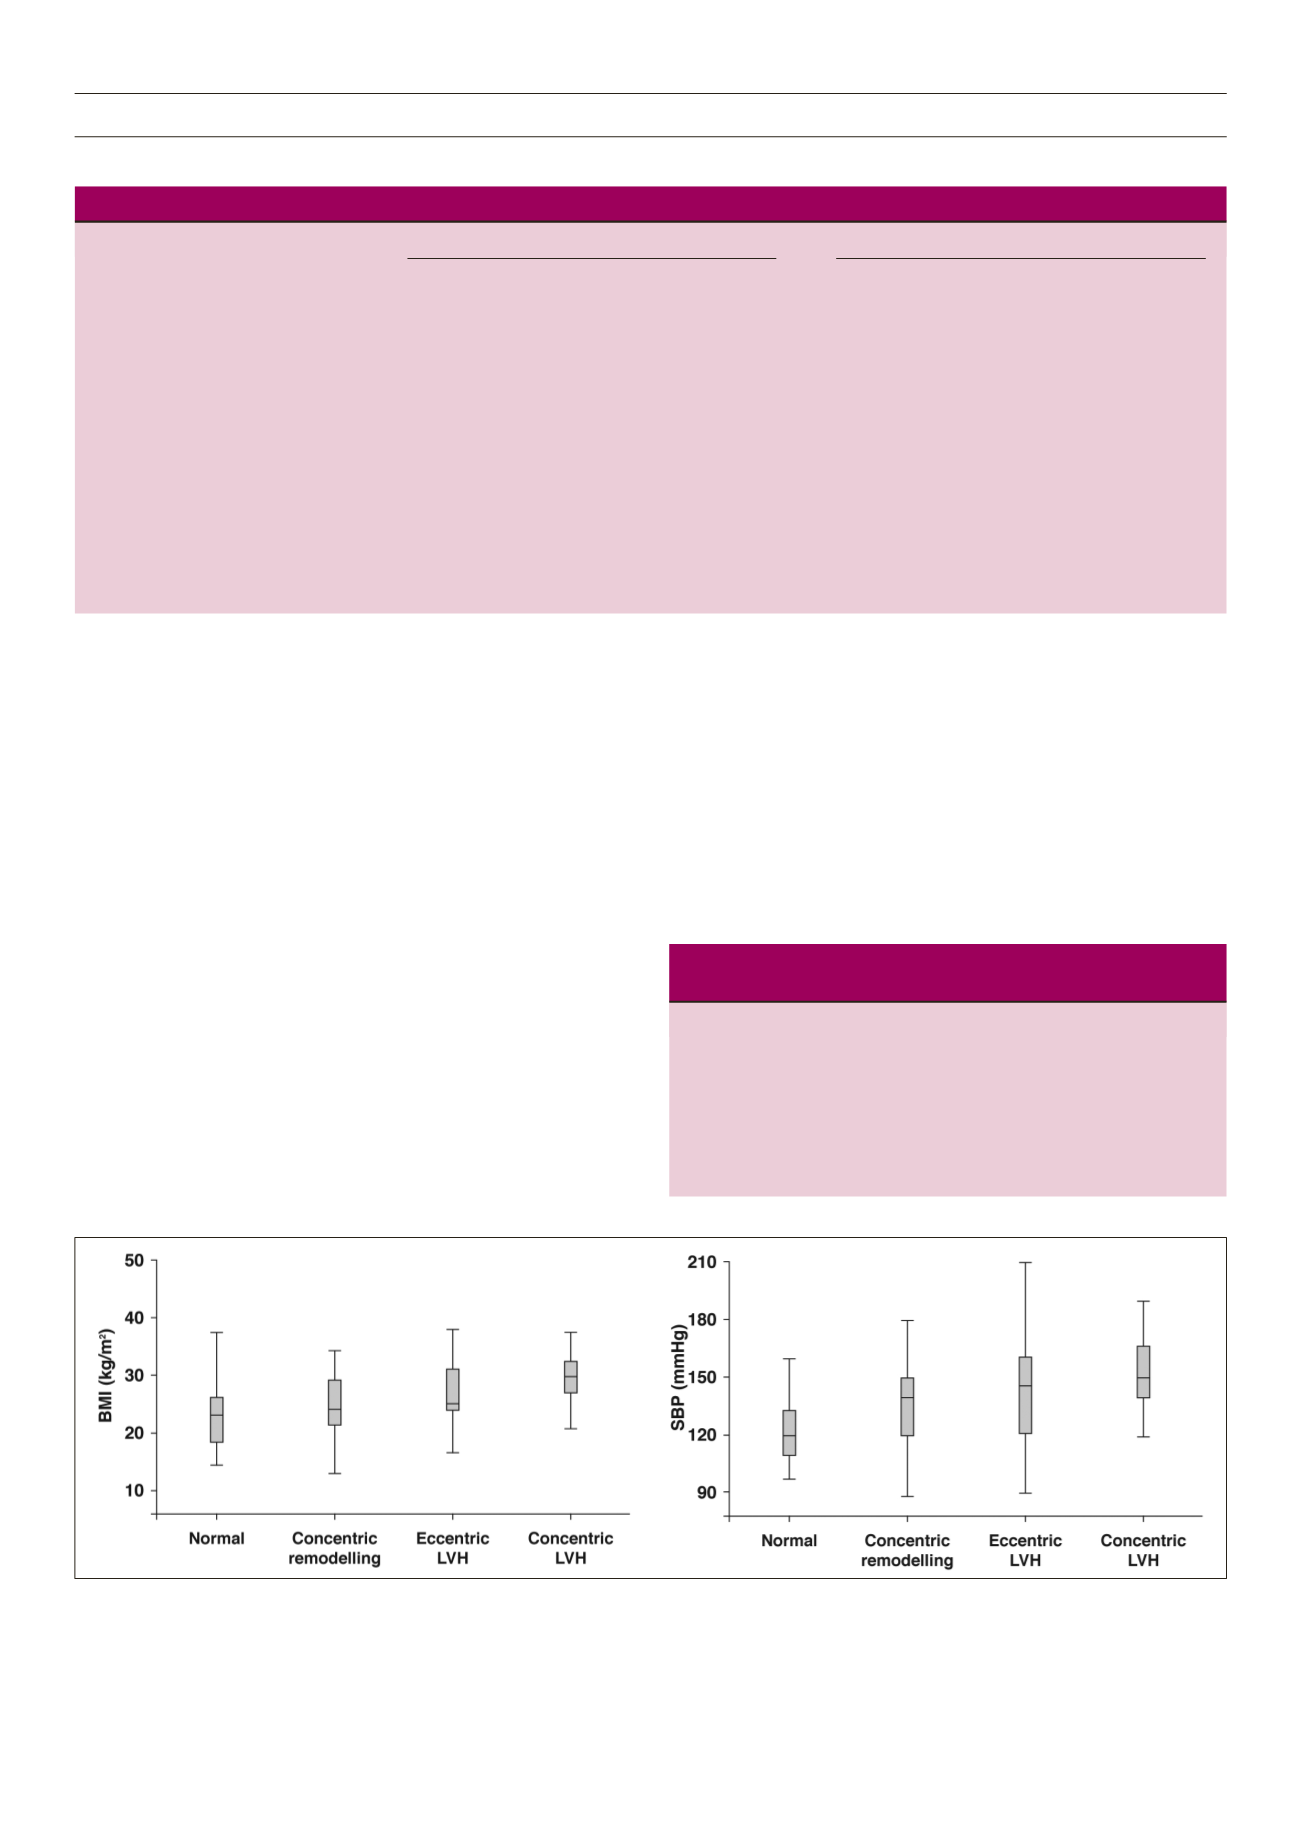
blood pressure and body mass index were among the most important
covariates of LV geometry in the total study population (Figs 2, 3).
In logistic regression analysis involving the total study population,
LV hypertrophy (combined eccentric and concentric LV hypertrophy)
was associated with obesity, (OR 3.97, 95% CI: 1.65–9.54,
p
=
0.002), hypertension (OR 4.58, 95% CI: 1.32–15.85,
p
= 0.016)
and albuminuria (OR 2.31, 95% CI: 1.01–5.27,
p
= 0.047). This was
independent of age, gender, type or duration of diabetes (Table 3).
The most prevalent types of abnormal LV geometry were
concentric remodelling in type 1 diabetes patients and concentric LV
hypertrophy in type 2 diabetes patients (Fig. 1). Overall, 58% of the
total population had increased RWT. In univariate linear regression
analysis, the most important correlates of higher RWT were older
age, higher blood pressure and higher log UACR, both in type 1
and type 2 diabetes patients (all
p
< 0.05) (Table 4). In addition,
lower eGFR and high-density lipoprotein (HDL) cholesterol were
significantly correlated with higher RWT among type 2 but not in
type 1 diabetes patients. Having increased RWT was also associated
Table 2.
Echocardiographic findings in type 1 and type 2 diabetes patients
Unadjusted
Adjusted for age and systolic blood pressure
Echocardiographic finding
Type 1 (
n
= 61)
Type 2 (
n
= 123)
p
-value
Type 1 (
n
= 61)
Type 2 (
n
= 123)
p
-value
Interventricular septum in diastole (cm)
0.91 ± 0.21
1.27 ± 0.31
< 0.001
1.11 ± 0.06
1.16 ± 0.04
0.573
LV posterior wall in diastole (cm)
0.79 ± 0.17
1.06 ± 0.25
< 0.001
0.94 ± (.05
0.98 ± 0.03
0.622
LV end-diastolic diameter (cm)
4.01 ± 0.63
4.21 ± 0.58
0.036
4.10 ± 0.13
4.16 ± 0.08
0.769
Relative wall thickness
0.40 ± 0.10
0.52 ± 0.19
< 0.001
0.48 ± 0.04
0.48 ± 0.02
0.938
LV mass/height
2.7
(g/m
2.7
)
33.0 ± 9.6
49.2 ± 16.8
< 0.001
40.6 ± 3.0
45.1 ± 1.8
0.299
Fractional shortening (%)
37 ± 5
35 ± 6
0.176
36 ± 1.3
36 ± 0.8
0.940
Stress-corrected fractional shortening (%)
99 ± 11
99 ± 16
0.942
100 ± 3
99 ± 2
0.739
Ejection fraction (%)
65 ± 7
63 ± 8
0.328
63 ± 2
64 ± 1
0.554
Midwall shortening (%)
16 ± 3
13 ± 3
< 0.001
14 ± 0.7
15 ± 0.4
0.875
Stress-corrected midwall shortening (%)
90 ± 17
74 ± 18
< 0.001
80 ± 3.8
81 ± 2.4
0.918
Transmitral E/A ratio
1.5 ± 0.4
0.9 ± 0.3
< 0.001
1.2 ± 0.8
1.1 ± 0.5
0.226
Deceleration time (ms)
165 ± 52
206 ± 61
< 0.001
191 ± 13
192 ± 8
0.954
Isovolumic relaxation time (ms)
62 ± 16
81 ± 20
< 0.001
78 ± 3.8
73 ± 2.4
0.378
Early tissue Doppler velocity (E’) (cm/s)
10.3 ± 2.3
6.5 ± 2.4
< 0.001
8.3 ± 0.5
7.5 ± 0.3
0.305
E/E’ ratio
9.5 ± 2.4
11.7 ± 4.4
< 0.001
11.2 ± 0.8
10.8 ± 0.5
0.733
Figure 2
. LV geometry in relation to body mass index and systolic blood pressure, and impact on comparison between the different LV geometric patterns;
p
< 0.001
for comparison of body mass index (left panel) and systolic blood pressure (right panel) in the four geometric patterns by ANOVA.
Table 3.
Independent predictors of LV hypertrophy in the total
population by logistic regression analysis
Variable
Odds ratio (95% CI)
p
-value
Obesity
3.97 (1.65–9.54)
0.002
Hypertension
4.58 (1.32–15.85)
0.016
Albuminuria
2.31 (1.01–5.27)
0.047
Age (years)
1.03 (0.98–1.08)
0.206
Male gender
0.66 (0.28–1.53)
0.329
Type of diabetes (type 1 vs type 2)
0.73 (0.13–4.17)
0.727
Duration of diabetes (years)
0.99 (0.92–1.06)
0.785