


 42 / 48

84
VOLUME 12 NUMBER 2 • NOVEMBER 2015
RESEARCH ARTICLE
SA JOURNAL OF DIABETES & VASCULAR DISEASE
300 mg/g.
13
Biochemical tests were performed with the use of a
chemistry analyser (Abbott Architect, Illinois, USA) at Muhimbili
National Hospital laboratory, which is the National reference
laboratory.
All patients gave written informed consent. The study was
ethically approved by the Muhimbili University of Health and Allied
Sciences’ research and publication committee.
All echocardiograms were performed by the same licensed
cardiologist, who had received special training in echocardiography
(PC), using a SONOS 7500 Phillips echocardiogrammachine. Patients
were examined in the left lateral decubitus position using a 3-MHz
transducer. The echocardiographic protocol included parasternal
long- and short-axis views of the left ventricle, left atrium and
aorta, as well as two-, three- and four-chamber images of the left
ventricle and pulsed Doppler recordings of LV filling. Spectral tissue
Doppler was recorded of mitral annular plane velocity in the apical
four-chamber view.
All images were recorded digitally on Magnetic Optical disks,
and interpretation of all digital echocardiograms was done at the
Department of Heart Diseases, Haukeland University Hospital using
a Tomtec (TomTech Imaging Systems GmbH, Unterschielssheim,
Germany) work station for post-processing. All studies were first
read by the primary investigator and then proof read by the senior
investigator, a highly experienced reader (EG).
Quantitative echocardiography was performed following the
American Society of Echocardiography guidelines.14 LV hypertrophy
was considered present when LVmass indexed for height
2.7
exceeded
49.2 g/m
2.7
in men and 46.7 g/m
2.7
in women.
15
RWT was calculated
as the ratio of end-diastolic posterior wall thickness to end-diastolic
LV internal radius and considered increased if ≥ 0.43.
Patients were categorised into four LV geometric patterns based
on LV mass/height
2.7
(LVMI) and RWT measurements in combination.
Normal geometry was considered present if LVMI and RWT were
both normal, concentric remodelling was the combination of
normal LVMI and increased RWT, eccentric hypertrophy was the
combination of LV hypertrophy and normal RWT, and concentric
LV hypertrophy was present if LV hypertrophy and increased RWT
were both present.
14
LV circumferential end-systolic stress (CESS) was estimated at
the midwall using a cylindrical model.
16
Myocardial contractility was
assessed by midwall fractional shortening (MWS), calculated using a
previously validated formula, taking into consideration the epicardial
migration of the midwall during systole.
17
Stress-corrected fractional
shortening (scFS) and stress-corrected MWS (scMWS) were calculated
as the ratio between actual and predicted FS and MWS for actual
CESS, respectively, using previously published equations.
17
Transmitral flowwas recorded with pulsed-wave Doppler between
the mitral cusp tips in the apical four-chamber view. The early (E) and
atrial (A) waves were traced for peak velocities and used to calculate
the E/A ratio. Isovolumic relaxation time was measured from the
leading edge of the aortic valve closure spike to the leading edge
of the mitral valve high-intensity echo in five-chamber view. Early
diastolic mitral annular plane velocity (E’) was measured by spectral
tissue Doppler in the apical fourchamber view.
18
Statistical analysis
Data management and statistical analysis was performed using SPSS
for Windows version 18.0. Data are presented as mean ± SD for
continuous variables and as percentages for categorical variables.
Groups of patients were compared using the
χ
2
test for categorical
variables and unpaired Student’s
t
-test, one way ANOVA with
Sheffe’s
post hoc
test or general linear model with Sidak’s
post hoc
test for continuous variables, as appropriate. Bivariate correlations
were assessed by Pearson’s correlation coefficients. Covariates of
increased RWT were identified in the total study population and
in groups of type 1 and type 2 diabetes patients by multiple linear
regression analyses, run with an enter procedure and co-linearity
statistics. A two-tailed
p
-value ≤ 0.05 was considered statistically
significant.
Results
The study population included 61 type 1 and 123 type 2 diabetes
patients. Compared to type 1 patients, type 2 patients were older,
had longer duration of diabetes and included more hypertensive
and obese patients (all
p
< 0.01) (Table 1).
Table 1.
Demographic and laboratory characteristics of type 1 and type
2 diabetes patients
Characteristic
Type 1 (
n
= 61) Type 2 (
n
= 123)
p
-value
Age (years)
21.7 ± 10.6
55.0 ± 9.6
< 0.001
Females,
n
(%)
34 (55)
78 (64)
0.265
Duration of diabetes (years)
8.2 ± 4.5
10.7 ± 6.3
0.005
Body mass index (kg/m
2
)
20.9 ± 4.4
28.4 ± 4.7
< 0.001
Obesity,
n
(%)
2 (3.3)
45 (36.6)
< 0.001
Waist circumference (cm)
74 ± 12
98 ± 11
< 0.001
Systolic blood pressure (mmHg) 117 ± 21
147 ± 22
< 0.001
Diastolic blood pressure (mmHg) 74 ± 14
88 ± 11
< 0.001
Hypertension,
n
(%)
11 (17.7)
100 (82.0)
< 0.001
Pulse pressure (mmHg)
43 ± 12
59 ± 17
< 0.001
Fasting blood glucose (mmol/l) 12.2 ± 4.4
10.4 ± 4.7
0.015
HbA
1c
(%)
10.9 ± 2.2
9.8 ± 2.3
0.003
Total cholesterol (mmol/l)
4.7 ± 1.6
5.6 ± 1.5
0.001
HDL cholesterol (mmol/l)
1.2 ± 0.4
1.2 ± 0.3
0.855
LDL cholesterol (mmol/l)
3.2 ± 1.3
4.0 ± 1.4
< 0.001
Triglycerides (mmol/l)
1.6 ± 1.6
1.7 ± 1.0
0.617
Serum creatinine (μmol/l)
84 ± 70
106 ± 77
0.058
eGFR (ml/min/1.73 m
2
)
106 ± 47
81 ± 24
< 0.001
Low eGFR,
n
(%)
6 (10)
21 (18)
0.268
Albuminuria,
n
(%)
24 (40.0)
39 (33.6)
0.412
Microalbuminuria,
n
(%)
16 (26.7)
33 (28.4)
0.860
Macroalbuminuria,
n
(%)
8 (13.3)
6 (5.2)
0.077
HbA
1c
= glycated haemoglobin, HDL = high-density lipoprotein, LDL = low-
density lipoprotein, eGFR = estimated glomerular filtration rate.
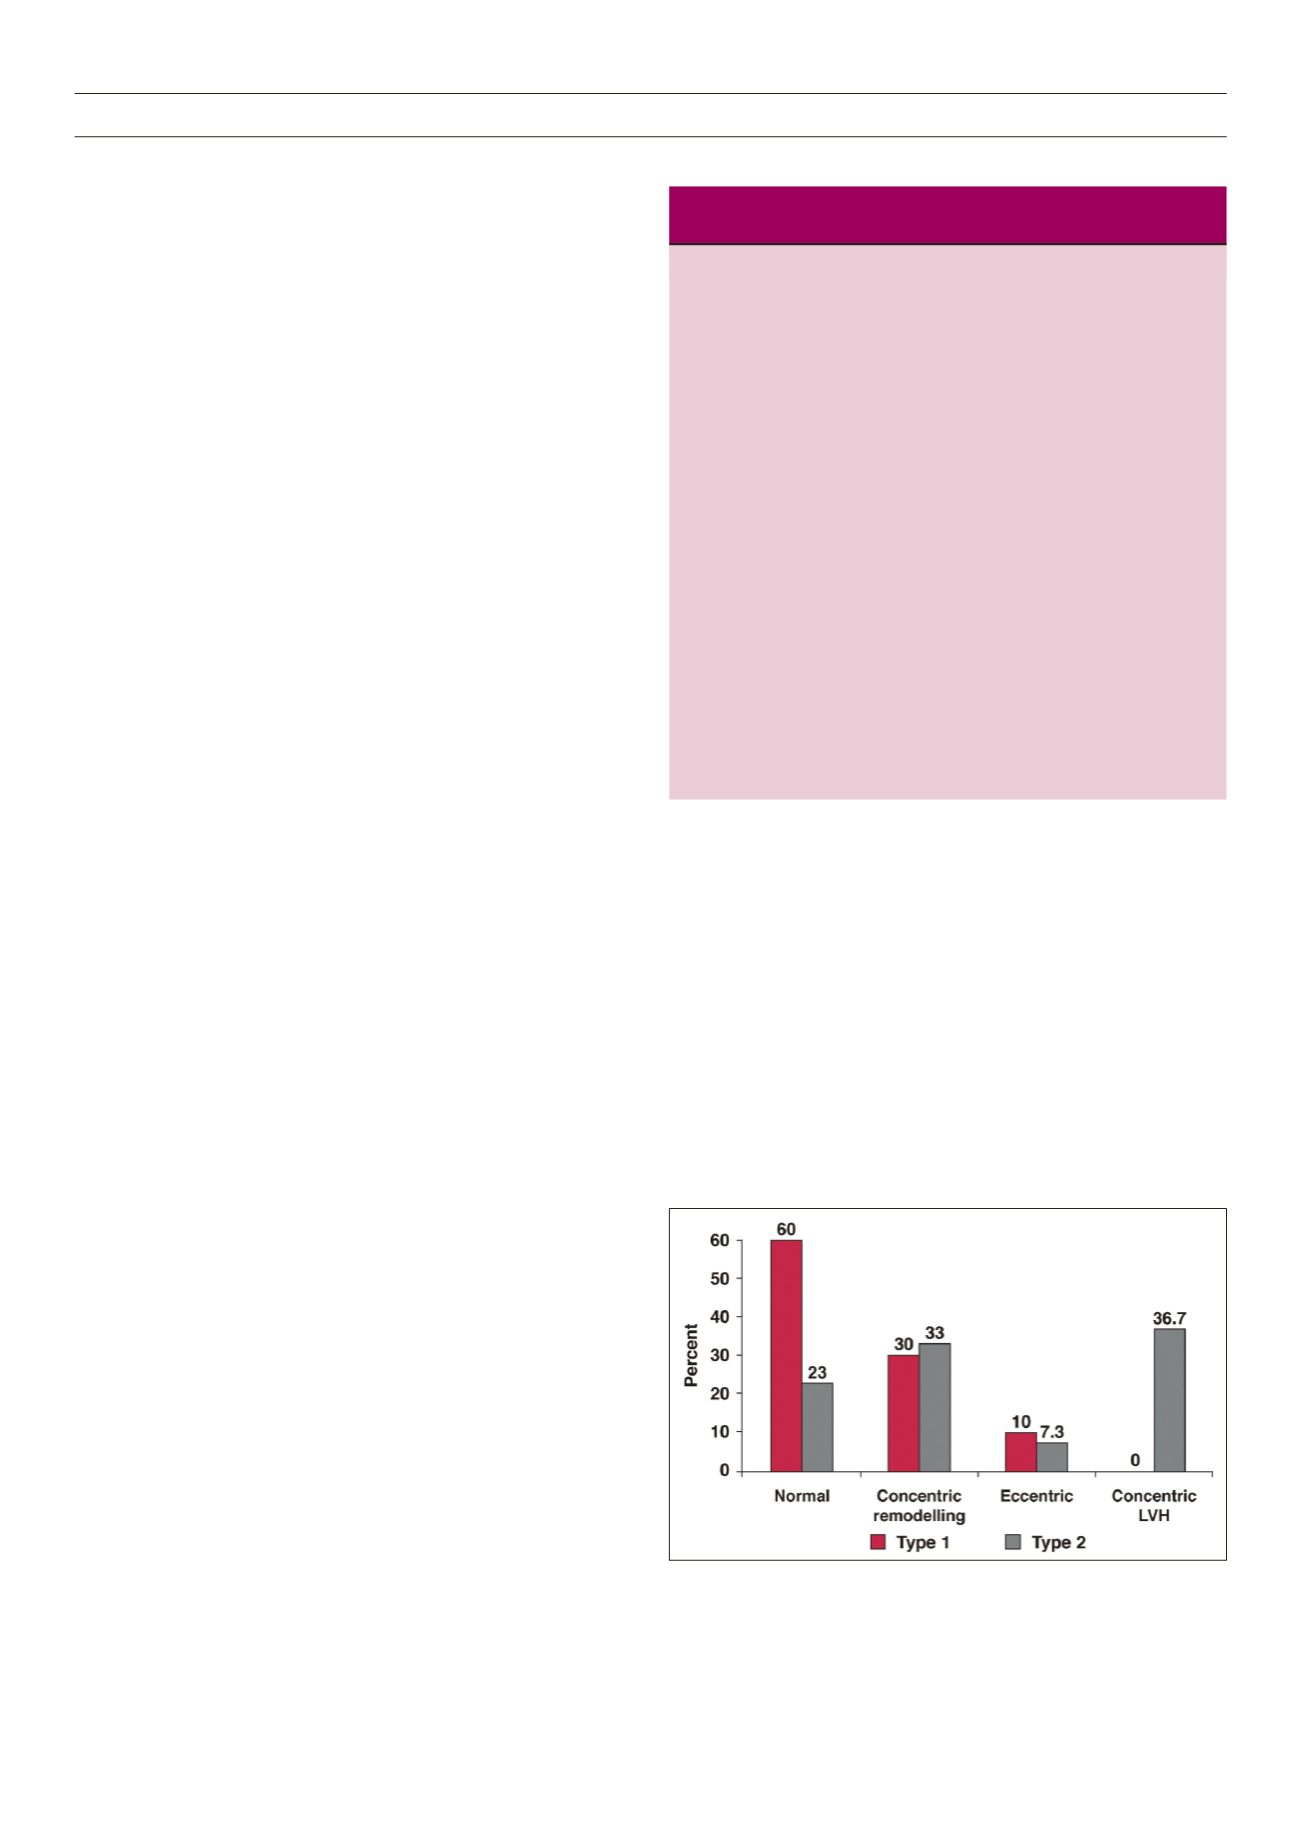
Figure 1
. LV geometric patterns in type 1 (red bars) and type 2 (grey bars)
diabetes patients. The differences between normal geometry and concentric LVH
were statistically significant, both
p
< 0.001.