


 33 / 48

VOLUME 12 NUMBER 2 • NOVEMBER 2015
75
SA JOURNAL OF DIABETES & VASCULAR DISEASE
RESEARCH ARTICLE
ECG-LVH increased by 15% per 10 mmHg higher systolic BP [OR
1.541 (95%CI, 1.089−2.185),
p
< 0.01] (Table 3). The prevalence of
ECG-LVH was also higher in hypertensive patients with albuminuria
compared to hypertensive patients without albuminuria.
The same model was used separately in type 1 diabetic patients. As
described earlier, all type 1 patients with ECG-LVH were diagnosed by
the Sokolow-Lyon criterion. Using the same model in these patients
did not identify any significant covariate of ECG-LVH.
In type 2 patients, 12 had ECG-LVH diagnosed by the Cornell
voltage-duration and 15 by the Sokolow-Lyon criteria. Applying
the same univariate logistic regression model on these two
groups of patients separately, it identified female gender, higher
age, increasing waist circumference, higher systolic and diastolic
BP and presence of hypertension or albuminuria as covariates of
ECG-LVH by the Cornell voltage-duration criterion (all
p
< 0.05).
In a multivariate analysis, systolic BP/10 mmHg was identified
as the strongest independent covariate, [OR 2.210 (95% CI,
1.395−3.504),
p
5 0.001], followed by female gender [OR 10.475
(95% CI, 1.272−86.274),
p
5 0.029]. In a similar model with ECG-
LVH by the Sokolow-Lyon criterion as the dependent variable,
albuminuria was the only significant covariate of ECG-LVH in both
univariate and multivariate logistic regression analyses [OR 1.001
(95% CI, 1.000−1.002),
p
< 0.05].
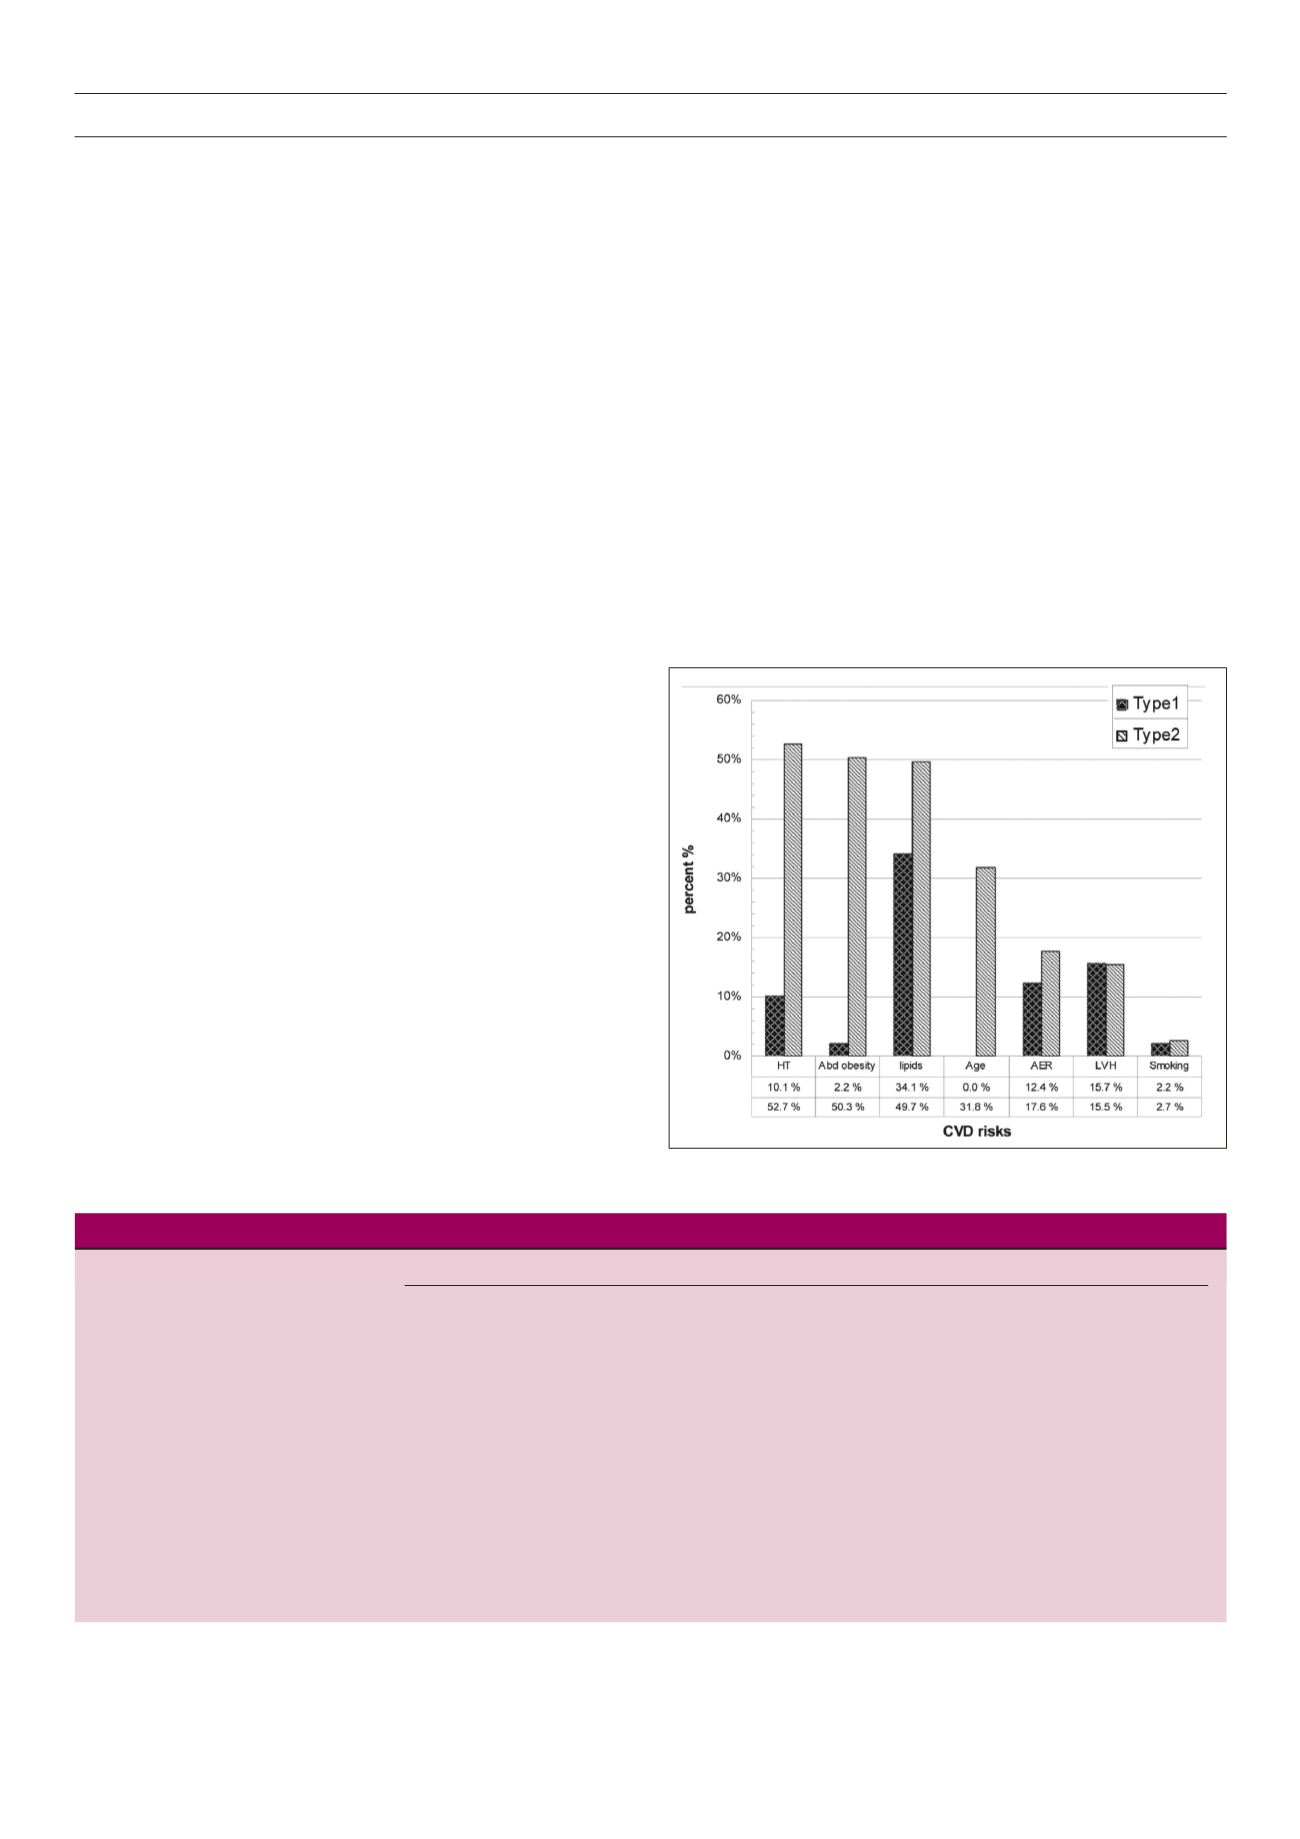
Clustering of the cardiovascular risk factors differed significantly
between type 1 and type 2 diabetics. On average, type 1 patients
had 0.8 (range 0−3) additional CV risk factor, while type 2 patients
on average had 2.2 (range 0−6). In type 1 diabetics, dyslipidaemia
in 30 (30.4%) and albuminuria in 11 (12.4%) patients were
the most common additional CV risk factors. In type 2 patients,
presence of hypertension was the most common additional CV
risk factor present in 78 (54.2%) patients, followed by abdominal
obesity, dyslipidaemia, albuminuria and advanced age (Fig. 1). In
type 1 patients, 15% of these had one additional CV risk factor
and 4.2% had two. Type 2 patients had up to six additional CV risk
factors, 14.4% having one, 14% having two and 14.4% having
three additional CV risk factors.
Relation of other ECG findings with CV risk factors
In the overall study population, the prevalence of intraventricular
conductance abnormalities was significantly higher in type 2
diabetics compared to type 1 patients (26 vs 9%,
p
< 0.001)
(Table 1). The prevalence of T-wave inversion and ST-segment
abnormality did not differ significantly between type 1 and type 2
patients (Table 1) and was significantly more common in patients
with ECG-LVH by either criterion (Table 2).
The associations between prevalence of intraventricular
conductance defects and other CV risk factors were assessed in
a logistic regression model, including gender, diabetes type, age,
diabetes duration, waist circumference, serum cholesterol, serum
creatinine, systolic BP, diastolic BP, ECG-LVH, albuminuria and QRS
duration among the covariates. In the univariatemodel, the presence
of intraventricular conductance defects was associated with older
age, longer duration of diabetes, higher systolic and diastolic BP
and longer QRS duration (Table 4). In multivariate analysis, higher
systolic BP was the only independent covariate of intraventricular
conductance defects.
In a similar model assessing covariates of ST-segment abnormality,
female gender [OR 0.43 (95% CI, 0.2−0.9),
p
5 0.034], patients
with ECG-LVH [OR 3.623 (95% CI, 1.456−9.015),
p
5 0.006] and
diastolic BP/5 mmHg [OR 1.189 (95% CI, 1.012−1.397),
p
5 0.035]
Table 3.
Covariates of LVH by either criteria in type 2 diabetic patients indentified by logistic regression analysis
LVH by any criteria
Covariates
Number with LVH (%)
Unadjusted (simple) OR (95% CI)
Adjusted (multivariate) OR (95% CI)
Gender: male
10 (15.4)
1.0
female
13 (15.7)
1.021 (0.417−2.504)
Age at inclusion (years)
23 (15.6)
1.016 (0.978−1.056)
Diabetes duration (years)
23 (15.5)
0.968 (0.884−1.060)
Waist circumference (cm)
22 (15.4)
0.990 (0.955−1.026)
Serum cholesterol (mmol/l)
23 (15.6)
1.131 (0.808−1.584)
Serum creatinine (mmol/l)
23 (15.6)
1.007 (0.992−1.023)
Systolic BP/10 mmHg
22 (15.3) 1.534
(1.081−2.176)**
1.541 (1.089−2.185)**
Diastolic BP/5 mmHg
22 (15.3)
1.131 (0.932−1.373)
Hypertension: no
9 (12.5)
1.0
Hypertension: yes
13 (18.1)
1.542 (0.614−3.874)
Normal AER
14 (11.6)
1.0
Abnormal AER
9 (34.6)
4.046 (1.517−10.796)**
Independent covariates involved in the logistic multivariate regression analysis are SBP/10 mmHg and AER. *
p
< 0.05, **
p
< 0.01, ***
p
< 0.001
Figure 1.
Clustering of cardiovascular risk factors for type 1 and 2 diabetics.