


 24 / 48

REVIEW
SA JOURNAL OF DIABETES & VASCULAR DISEASE
66
VOLUME 12 NUMBER 2 • NOVEMBER 2015
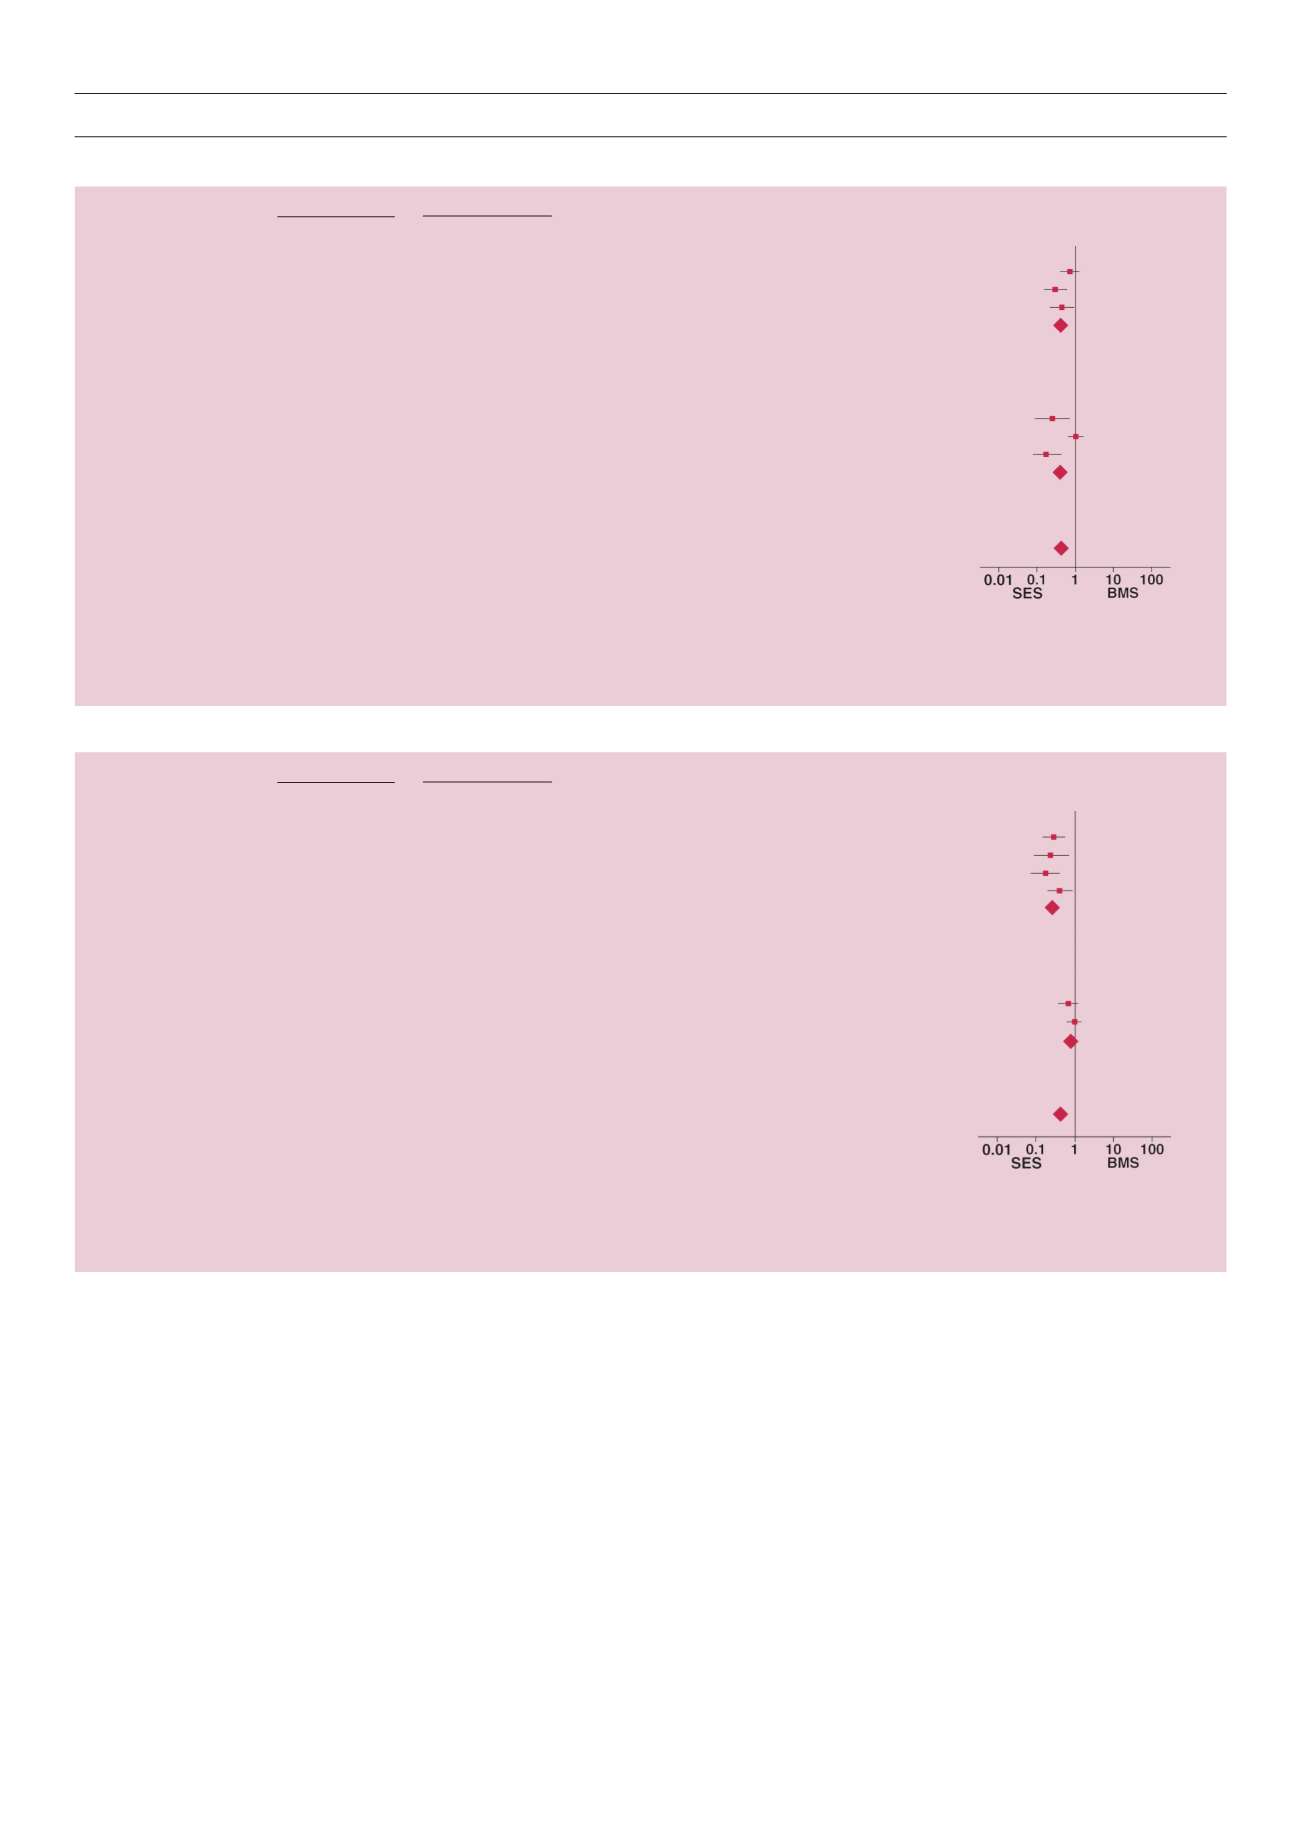
Figure 6. B:
Forest plots of ethnicity subgroups.
C:
RCT or non-RCT subgroups.
B
SES
BMS
Odds ratio
Odds ratio
Study or subgroup
Events
Total
Events
Total
Weight (%)
M–H, random, (95% CI)
M–H, random, (95% CI)
1.1.1 European Subgroup
Aoki J,
et al.
27
112
37
118
18.5
0.70 (0.39–1.24)
Baumgart D,
et al.
15
94
38
96
17.2
0.29 (0.15–0.58)
Maresta A,
et al.
15
68
28
70
16.4
0.42 (0.20–0.90)
Subtotal (95% CI) 274 284
52.1
0.45 (0.27–0.77)
Total events
57
103
Heterogeneity: Tau
2
= 0.10, Chi
2
= 3.71, df = 2 (
p
= 0.16);
I
2
= 46%
Test for overall effect: Z = 2.95 (
p
= 0.003)
1.1.2 American and Asian
Chan C,
et al.
8
54
12
29
12.8
0.25 (0.09–0.71)
Daemen J,
et al.
44
206
54
252
20.1
1.00 (0.64–1.56)
Jimenez-Quevedo P,
et al.
8
80
31
80
15.0
0.18 (0.07–0.41)
Subtotal (95% CI) 340 361
47.9
0.37 (0.11–1.27)
Total events
60
97
Heterogeneity: Tau
2
= 1.02, Chi
2
= 15.55, df = 2 (
p
= 0.0004);
I
2
= 87%
Test for overall effect: Z = 1.58 (
p
= 0.11)
Total (95% CI) 614 645
100.0
0.42 (0.24–0.74)
Total events
117
200
Heterogeneity: Tau
2
= 0.36, Chi
2
= 20.14, df = 5 (
p
= 0.001); I
2
= 75%
Test for overall effect: Z = 3.00 (
p
= 0.003)
Test for subgroup differences: Chi
2
= 0.09, df = 1 (
p
= 0.77);
I
2
= 0%
C
SES
BMS
Odds ratio
Odds ratio
Study or subgroup
Events
Total
Events
Total
Weight (%)
M–H, random, (95% CI)
M–H, random, (95% CI)
5.1.1 RCT
Baumgart D,
et al.
15
94
38
96
17.2
0.29 (0.15–0.58)
Chan C,
et al.
8
54
12
29
12.8
0.25 (0.09–0.71)
Jimenez-Quevedo P,
et al.
8
80
31
80
15.0
0.18 (0.07–0.41)
Maresta A,
et al.
15
68
28
70
16.4
0.42 (0.20–0.90)
Subtotal (95% CI) 296 275
61.4
0.28 (0.19–0.42)
Total events
46
109
Heterogeneity: Tau
2
= 0.00, Chi
2
= 2.40, df = 3 (
p
= 0.49);
I
2
= 0%
Test for overall effect: Z = 6.14 (
p
= 0.00001)
5.1.2 Non-RCT
Aoki J,
et al.
27
112
37
118
18.5
0.70 (0.39–1.24)
Daemen J,
et al.
44
206
54
252
20.1
1.00 (0.64–1.56)
Subtotal (95% CI) 318 370
38.6
0.87 (0.61–1.24)
Total events
71
91
Heterogeneity: Tau
2
= 0.00, Chi
2
= 0.92, df = 1 (
p
= 0.34);
I
2
= 0%
Test for overall effect: Z = 0.76 (
p
= 0.45)
Total (95% CI) 614 645
100.0
0.42 (0.24–0.74)
Total events
117
200
Heterogeneity: Tau
2
= 0.36, Chi
2
= 20.14, df = 5 (
p
= 0.001);
I
2
= 75%
Test for overall effect: Z = 3.00 (
p
= 0.003)
Test for subgroup differences: Chi
2
= 16.81, df = 1 (
p
< 0.0010);
I
2
= 94.1%
Heterogeneity is one major concern with regard to the
validity of meta-analyses.
26,34
Non-homogeneous data can easily
give misleading results. In our study, the
Q
and
I
2
statistics were
performed to test heterogeneity. For all samples, there was
significant heterogeneity for major adverse cardiac events in the
SES and BMS groups.
We further conducted subgroup analysis according to sample
size, ethnicity and studymethod. It demonstrated that in the studies
where sample size was ≤ 90, method was a RCT and population
was European, the overall major cardiac events were significantly
different between the SES and BMS groups. Heterogeneity
between the studies was decreased after stratifying the samples.
No significant heterogeneity was observed with RCTs, suggesting
an RCT is important for good results. More high-quality RCTs are
therefore warranted.
Another concern for meta-analyses is publication bias, due
to selection of the studies included. In this study, using funnel
plots and Egger’s test,
28,35,36
we found publication bias for overall
major cardiac events, target-lesion revascularisations and
myocardial infarction, but not for overall mortality. Furthermore,
the sensitivity analysis confirmed there was no change if one
study was removed at a time. Although more studies would
have produced better results, overall, our results were statistically
reliable.