


 22 / 48

REVIEW
SA JOURNAL OF DIABETES & VASCULAR DISEASE
64
VOLUME 12 NUMBER 2 • NOVEMBER 2015
subjects with diabetes (SES 614 and BMS 645) were included, with
an average age of 65 years. The sample sizes ranged from 83 to
458, and the studies were RCTs and non-RCTs.
The efficacy of SES versus BMS is presented in Table 2. As shown,
the pooled OR was 0.42 (95% CI: 0.24–0.74,
p
< 0.01) for SES
versus BMS. This suggests that, after the data had been pooled,
SES were more effective than BMS in CAD patients with diabetes.
However, there was publication bias (
t
= –4.19,
p
< 0.05).
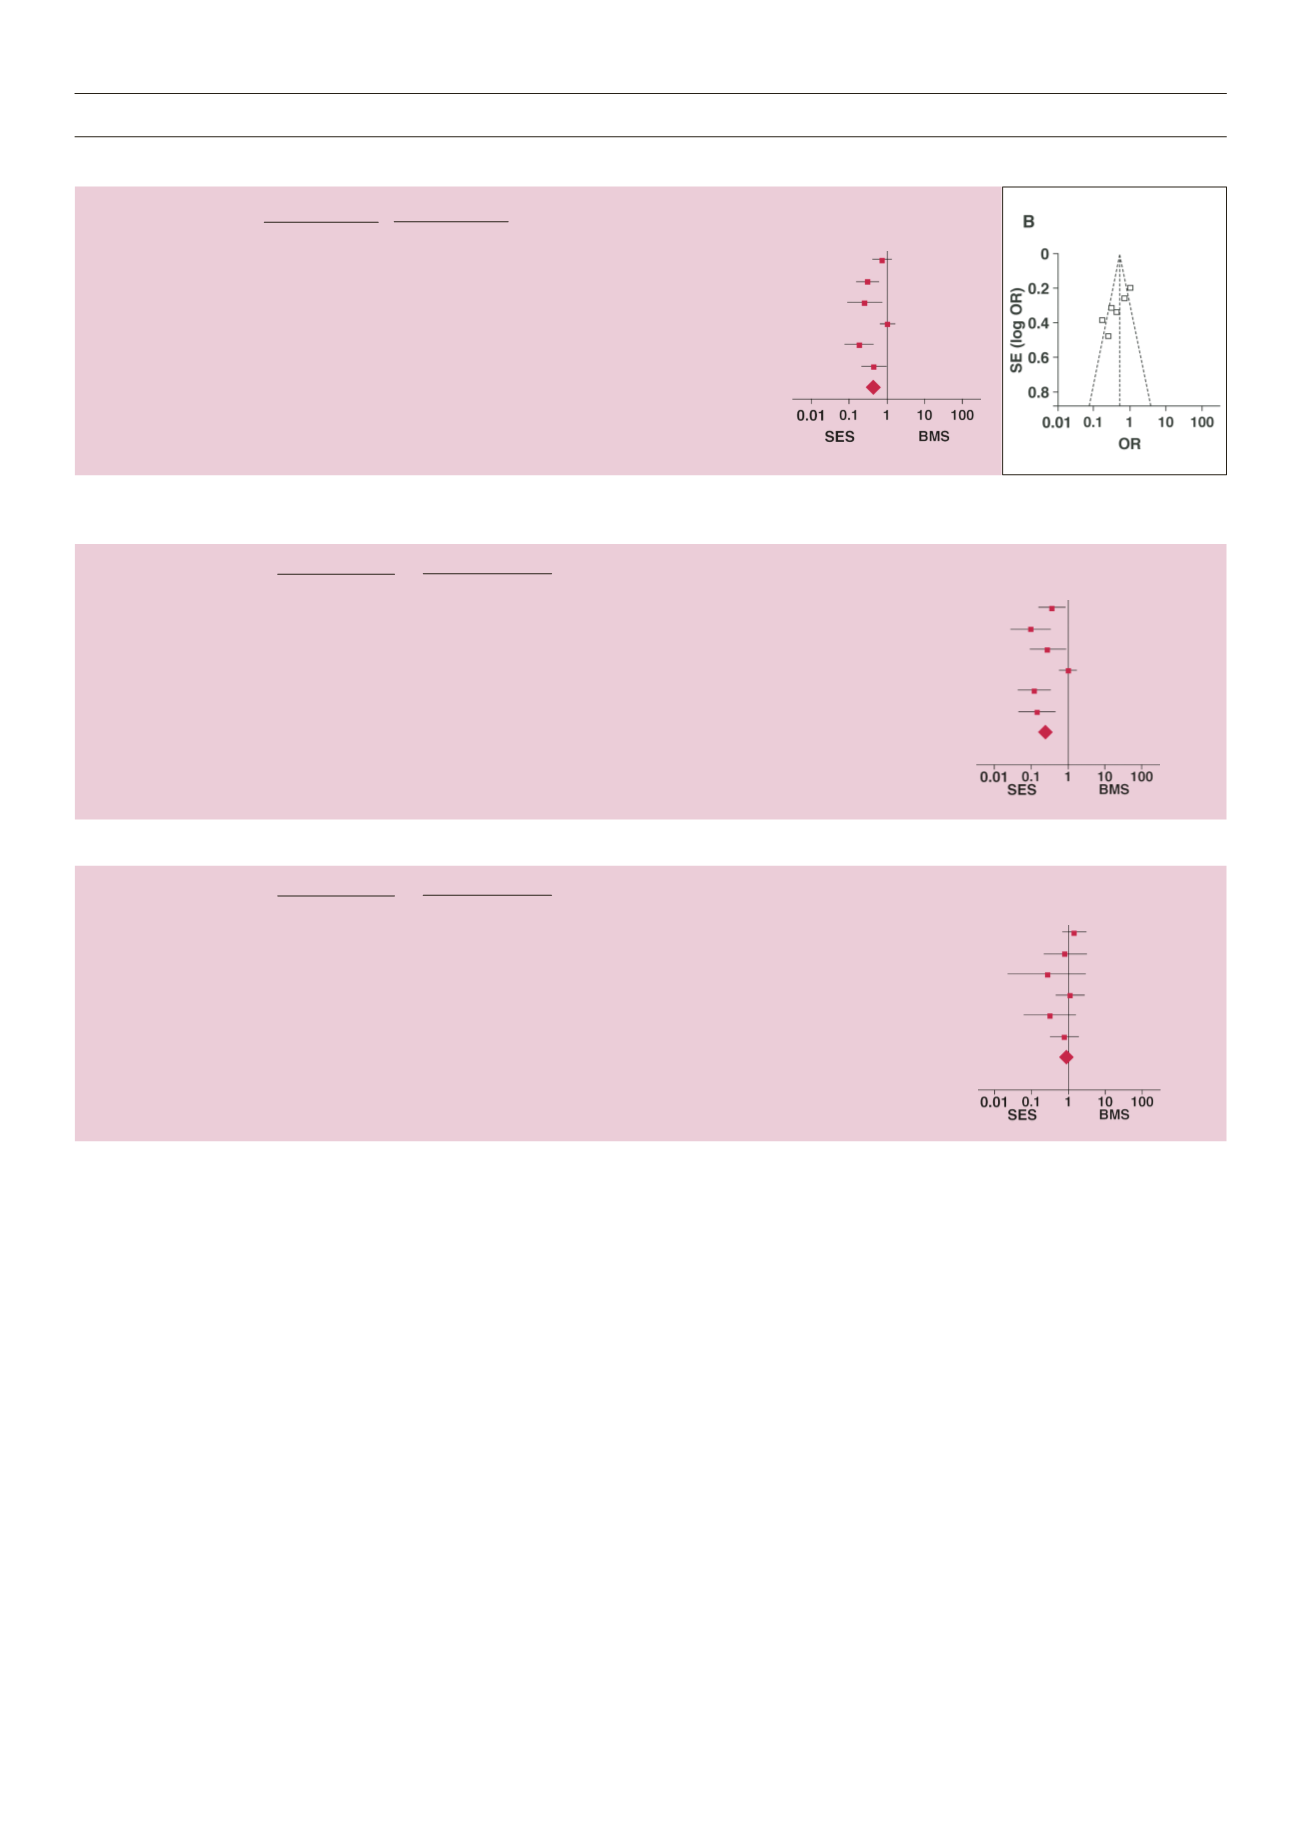
As shown in Fig. 2A, the pooled OR was 0.42 (95% CI: 0.24–
0.74,
p
< 0.01) for overall events, suggesting that SES had a better
outcome compared with BMS, with a greater reduction in risk for
major cardiac events. However, there were heterogeneities between
the studies (
Q
2
= 20.14,
I
2
= 75.0%,
p
< 0.1) and publication bias,
as shown in Fig. 2B (asymmetric funnel plot). This was further
confirmed with Egger’s linear regression test, shown in Table 2 (
t
= –4.19,
p
< 0.05).
As shown in Fig. 3, the pooled OR was 0.26 (95% CI: 0.11–0.59,
p
< 0.01) for SES versus BMS, suggesting that SES had a better
revascularisation rate for target lesions comparedwith BMS. However,
there were heterogeneities between the studies (
Q
2
= 24.44,
I
2
=
80.0%,
p
< 0.1) and publication bias (
t
= –6.44, p < 0.05).
As shown in Fig. 4, the pooled OR was 0.92 (95% CI: 0.61–
1.40,
p
> 0.05) for SES versus BMS, suggesting that the overall risk
for myocardial infarction was not significantly different between
these two groups. There was no heterogeneity between the studies
(
Q
2
= 4.37,
I
2
= 0%,
p
> 0.1) but there was publication bias (
t
=
–3.44,
p
< 0.05).
As shown in Fig. 5, the pooled OR was 1.19 (95% CI: 0.74–1.92,
p
> 0.05) for SES versus BMS, suggesting that the overall risk of
mortality was not significantly different between the groups. There
was no publication bias (
t
= –1.69,
P
> 0.05) or heterogeneities
between the studies (
Q
2
= 3.88,
I
2
= 0.0%,
p
> 0.1).
Subgroup analyses were stratified by sample size, subjects’
geographical area and study method. As shown in Table 2 and
Figure 6A–C, the pooled OR was 0.28 (95% CI: 0.16–0.48,
p
<
0.01, Fig. 6A) for SES versus BMS in studies whose sample size was
A
SES
BMS
Odds ratio
Odds ratio
Study or subgroup
Events Total Events Total Weight (%) M–H, random, (95% CI) M–H, random, (95% CI)
Aoki J,
et al.
27
112
37
118
18.5
0.70 (0.39–1.24)
Baumgart D,
et al.
15
94
38
96
17.2
0.29 (0.15–0.58)
Chan C,
et al.
8
54
12
29
12.8
0.25 (0.09–0.71)
Daemen J,
et al.
44
206
54
252
20.1
1.00 (0.64–1.56)
Jimenez-Quevedo P,
et al.
8
80
31
80
15.0
0.18 (0.07–0.41)
Maresta A,
et al.
15
68
28
70
16.4
0.42 (0.20–0.90)
Total (95% CI) 614 645
100.0
0.42 (0.24–0.74)
Total events
117
200
Heterogeneity: Tau
2
= 0.36; Chi
2
= 20.14, df = 5 (
p
= 0.001); I2 = 75%
Test for overall effect: Z = 3.00 (
p
= 0.003)
SES
BMS
Odds ratio
Odds ratio
Study or subgroup
Events
Total
Events
Total
Weight (%)
M–H, random, (95% CI)
M–H, random, (95% CI)
Aoki J,
et al
.
9
112
23
118
17.9
0.36 (0.16–0.82)
Baumgart D,
et al
3
94
24
96
14.6
0.10 (0.03–0.34)
Chan C,
et al
.
7
54
10
29
15.7
0.28 (0.09–0.85)
Daemen J,
et al
.
28
206
35
252
19.9
0.98 (0.57–1.67)
Jimenez-Quevedo P,
et al
5
80
28
80
16.4
0.12 (0.04–0.34)
Maresta A,
et al
.
4
68
21
70
15.5
0.15 (0.05–0.45)
Total (95% CI) 614 645
100.0
0.26 (0.11–0.59)
Total events
56
141
Heterogeneity: Tau
2
= 0.83; Chi
2
= 24.44, df = 5 (
p
= 0.0002);
I
2
= 80%
Test for overall effect: Z = 3.22 (
p
= 0.001)
SES
BMS
Odds ratio
Odds ratio
Study or subgroup
Events
Total
Events
Total
Weight (%)
M–H, random, (95% CI)
M–H, random, (95% CI)
Aoki J,
et al
.
18
112
14
118
25.1
1.42 (0.67–3.02)
Baumgart D, et al.
4
94
5
96
10.4
0.81 (0.21–3.11)
Chan C,
et al
.
1
54
2
29
5.6
0.25 (0.02–2.94)
Daemen J,
et al
.
10
206
11
252
20.7
1.12 (0.47–2.69)
Jimenez-Quevedo P,
et al
.
2
80
6
80
12.8
0.32 (0.06–1.62)
Maresta A,
et al
.
11
68
14
70
25.4
0.77 (0.32–1.85)
Total (95% CI) 614 645
100.0
0.92 (0.61–1.40)
Total events
46
52
Heterogeneity: Chi
2
= 4.37, df = 5 (
p
= 0.50);
I
2
= 0%
Test for overall effect: Z = 0.37 (
p
= 0.71)
Figure 2
. A: Forest plots of studies with major adverse cardiac events in the SES group versus the BMS group. B: Funnel plots of studies with major adverse cardiac
events in the SES group versus the BMS group.
Figure 3
. Forest plots of studies with target-lesion revascularisation events in the SES group versus the BMS group.
Figure 4
. Forest plots of studies with myocardial infarction events in the SES group versus the BMS group.