


 23 / 48

SA JOURNAL OF DIABETES & VASCULAR DISEASE
REVIEW
VOLUME 12 NUMBER 2 • NOVEMBER 2015
65
above 90, with heterogeneities between the studies (
Q
2
= 8.7,
I
2
= 77%,
p
< 0.1). The pooled OR was 0.61 (95% CI: 0.31–1.21,
p
> 0.05, Fig. 6A) in studies whose sample size was 90 or less,
without heterogeneities between the studies (
Q
2
= 2.39,
I
2
= 16%,
p
> 0.1).
The pooled OR was 0.45 (95% CI = 0.27–0.77,
p
< 0.01, Fig. 6B)
in studies whose subjects were European, without heterogeneities
between the studies (
Q
2
= 3.71,
I
2
= 46%,
p
> 0.1). The pooled OR
was 0.37 (95% CI: 0.11–1.27,
p
> 0.05, Fig. 6B) in studies whose
subjects were American and Asian, with heterogeneities between
the studies (
Q
2
= 15.55, I2 = 87%,
p
< 0.1).
The pooled OR was 0.28 (95% CI: 0.19–0.42,
p
< 0.01, Fig. 6C)
in studies whose study method was RCT, without heterogeneities
between the studies (
Q
2
= 2.4, I2 = 0%,
p
> 0.1).
The pooled OR was 0.87 (95% CI: 0.61–1.24,
p
> 0.05, Fig.
6C) in studies whose method of study was non-RCT, without
heterogeneities between the studies (
Q
2
= 0.92, I2 = 0%,
p
> 0.1).
By removing one study at a time, a sensitivity analysis was
performed and the model was rerun to determine the effect on
each estimate. It showed that the above meta-analysis estimates
did not change significantly after removal of each study, implying
that these results were statistically reliable.
SES
BMS
Odds ratio
Odds ratio
Study or subgroup
Events
Total
Events
Total
Weight (%)
M–H, random, (95% CI)
M–H, random, (95% CI)
Aoki J,
et al.
13
112
8
118
22.2
1.81 (0.72–4.54)
Baumgart D,
et al.
5
94
3
96
12.1
1.29 (0.34–4.97)
Chan C,
et al.
0
54
2
29
10.3
0.10 (0.00–2.18)
Daemen J,
et al.
15
206
16
252
43.0
1.16 (0.56–2.40)
Jimenez-Quevedo P,
et al.
1
80
2
80
6.4
0.49 (0.04–5.56)
Maresta A,
et al.
3
68
2
70
6.1
1.57 (0.25–9.70)
Total (95% CI) 614 645
100.0
1.19 (0.74–1.92)
Total events
37
34
Heterogeneity: Chi
2
= 3.88, df = 5 (
p
= 0.57);
I
2
= 0%
Test for overall effect: Z = 0.72 (
p
= 0.47)
Discussion
A growing number of studies has shown the efficacy and safety
of SES versus BMS for treating CAD patients with diabetes,
9,29
but
the outcome has been controversial. In this analysis, we retrieved
six studies, which included 1 259 CAD subjects with diabetes, and
performed a meta-analysis. It showed that the SES group had a
significant reduction in major adverse cardiac events, as well as
target-lesion revascularisations, compared with the BMS group.
There was no significant difference for myocardial infarction or
mortality.
These results are consistent with a recent study that suggested
a significant reduction in target-vessel revascularisations with SES,
but with similar mortality rates.
9
Unlike this study, in which the
incidence of myocardial infarction was higher, our analysis showed
no difference for myocardial infarctions between the groups.
Another recent study conducted in Europeans confirmed
the efficacy of SES compared with BMS, along with comparable
mortality rates and myocardial infarctions,
11
which further proved
the validity of our analysis. The efficacy and safety of SES have been
receiving more and more supportive reports.
30-33
The uniqueness of
our analysis and findings is that it proved the efficacy and safety of
SES in CAD patients with diabetes.
Figure 5
. Forest plots of studies with mortality events in the SES group versus the BMS group.
A
SES
BMS
Odds ratio
Odds ratio
Study or subgroup
Events
Total
Events
Total
Weight (%)
M–H, random, (95% CI)
M–H, random, (95% CI)
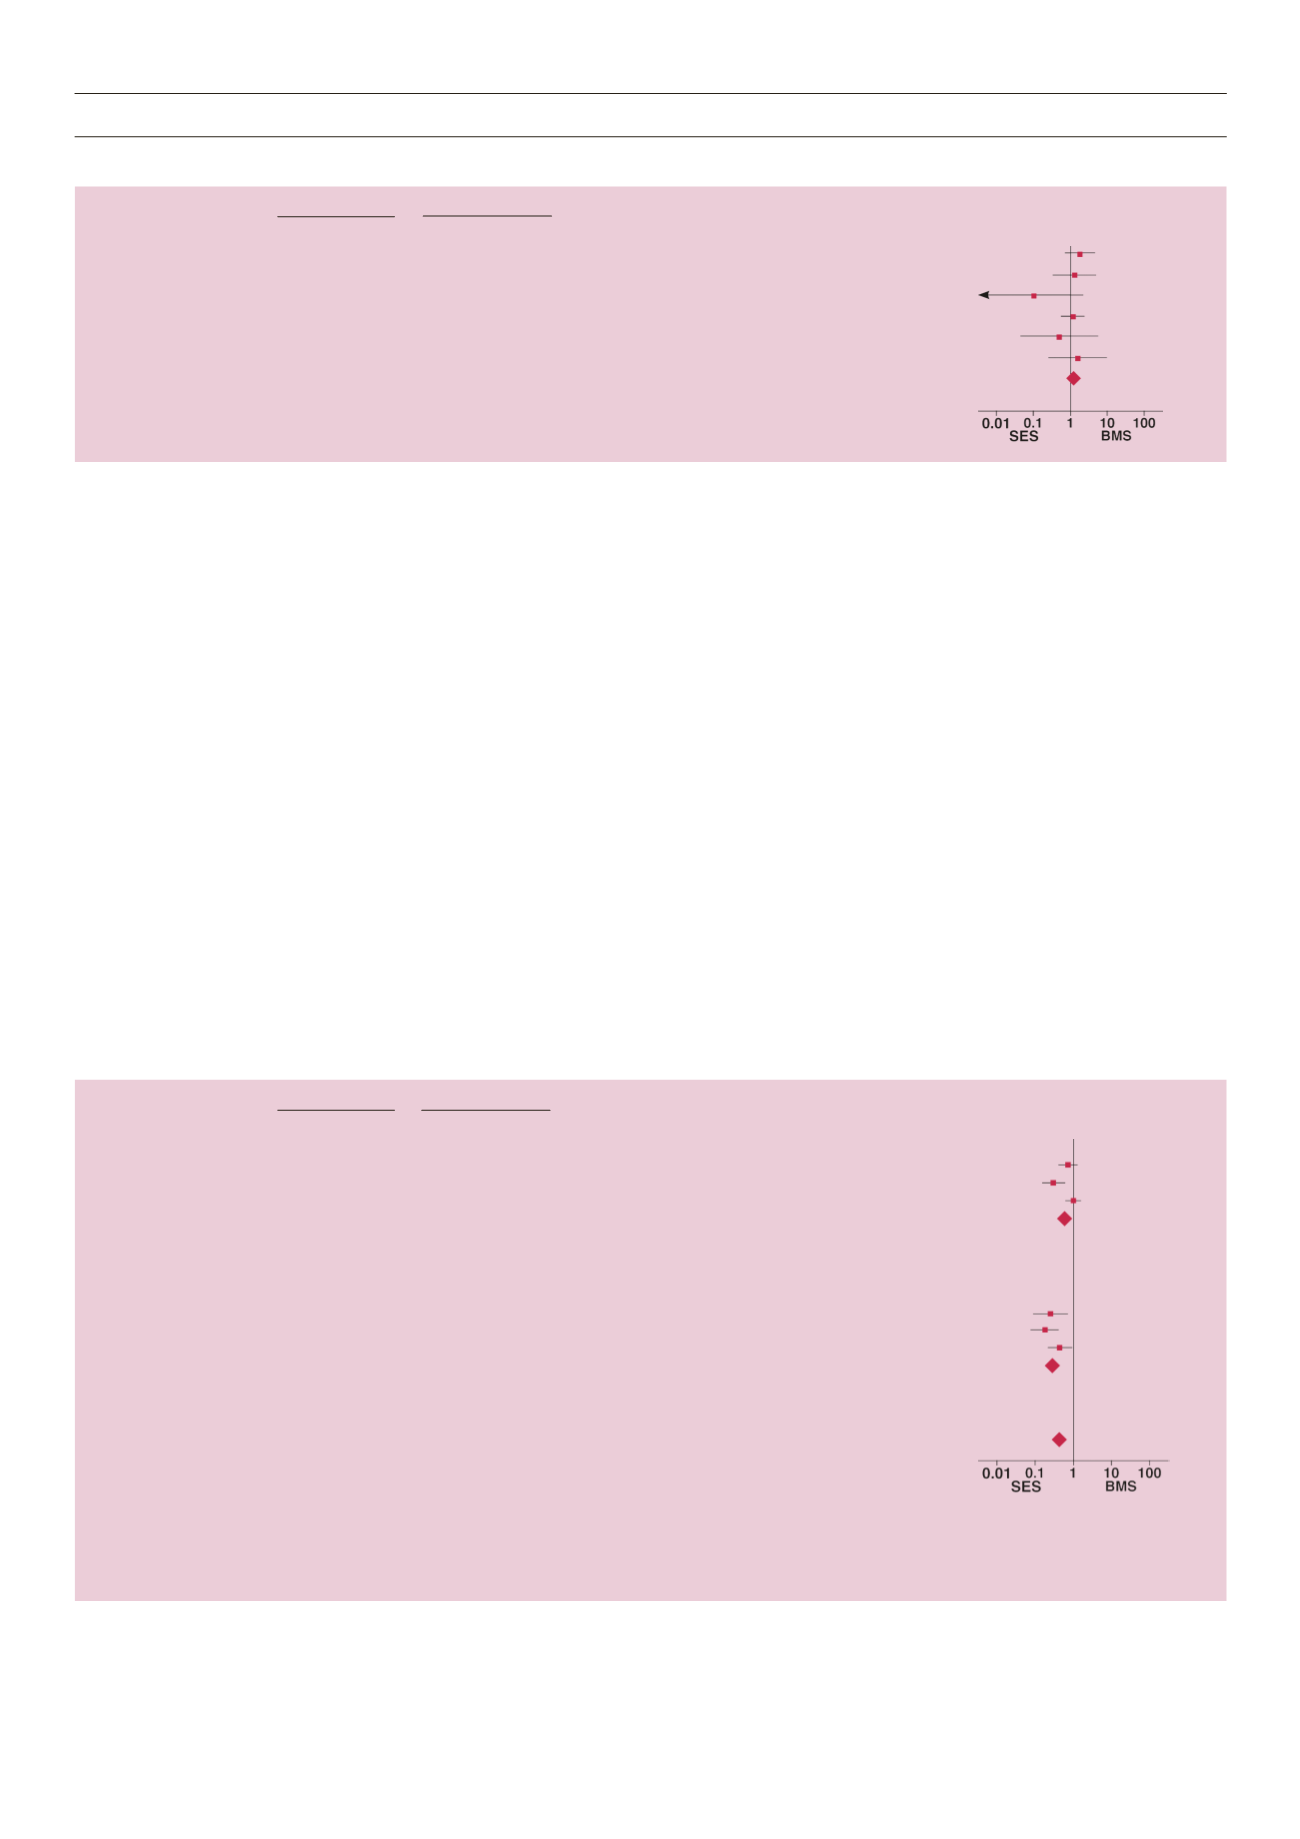
6.2.2 Both groups’ sample size > 90
Aoki J,
et al.
27
112
37
118
18.5
0.71 (0.39–1.24)
Baumgart D,
et al.
15
94
38
96
17.2
0.29 (0.15–0.58)
Daemen J,
et al.
44
206
54
252
20.1
1.00 (0.64–1.56)
Subtotal (95% CI) 412 466
55.8
0.61 (0.31–1.20)
Total events
86
129
Heterogeneity: Tau
2
= 0.28, Chi
2
= 8.70, df = 2 (
p
= 0.01);
I
2
= 77%
Test for overall effect: Z = 1.42 (
p
= 0.15)
6.2.3 Both groups’ sample size ≤ 90
Chan C,
et al.
8
54
12
29
12.8
0.25 (0.09–0.71)
Jimenez-Quevedo P,
et al.
8
80
31
80
15.0
0.18 (0.07–0.41)
Maresta A,
et al.
15
68
28
70
16.4
0.42 (0.20–0.90)
Subtotal (95% CI) 202 179
44.2
0.28 (0.16–0.48)
Total events
31
71
Heterogeneity: Tau
2
= 0.04, Chi
2
= 2.39, df = 2 (
p
= 0.30);
I
2
= 16%
Test for overall effect: Z = 4.60 (p < 0.00001)
Total (95% CI) 614 645
100.0
0.42 (0.24–0.74)
Total events
117
200
Heterogeneity: Tau
2
= 0.36, Chi
2
= 20.14, df = 5 (
p
= 0.001); I
2
= 75%
Test for overall effect: Z = 3.00 (
p
= 0.003)
Test for subgroup differences: Chi
2
= 3.12, df = 1 (
p
= 0.08);
I
2
= 68.0%
Figure 6. A:
Forest plots of sample size subgroups