


 32 / 44

RESEARCH ARTICLE
SA JOURNAL OF DIABETES & VASCULAR DISEASE
30
VOLUME 14 NUMBER 1 • JULY 2017
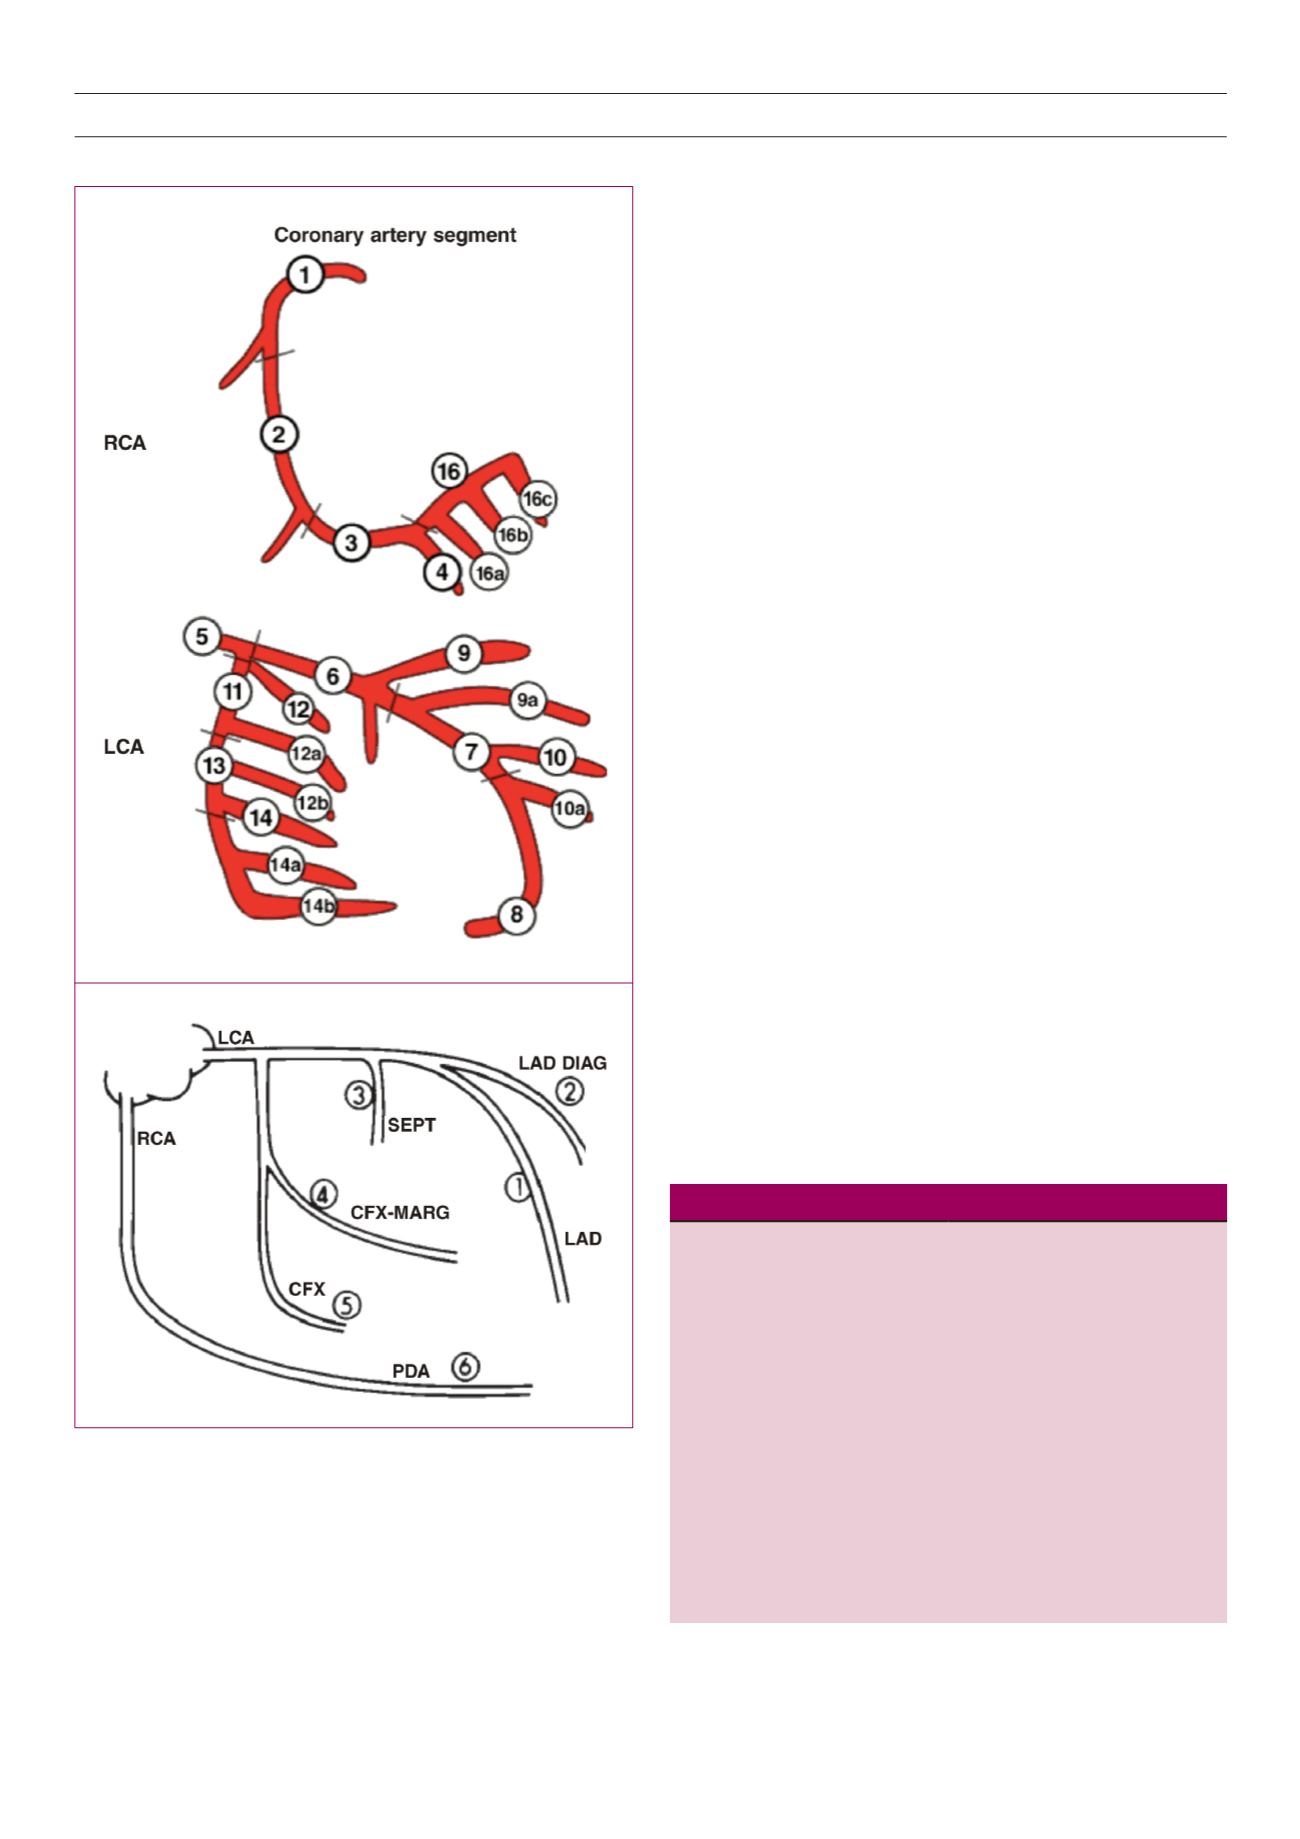
jeopardy score, developed by Dash
et al
., 1977,
17
and validated by
Califf
et al
.,1985,
18
detects the main vessels affected in their large
branches, Fig. 1B).
Coronary angiographies of patients were reviewed by two
experts who were blinded to the patients’ BMI and WHR. Patients
were divided into five groups according to their BMI; normal BMI
(21–24 kg/m
2
), overweight (25–29 kg/m
2
), class I obesity (30–34 kg/
m
2
), class II obesity (35–39 kg/m
2
) and class III obesity (> 40 kg/m
2
).
Also patients were divided into four groups according to their age;
20–39, 40–59, 60–79 and > 80 years old.
Inclusion criteria were patients over 20 years old who had
definite indications for coronary angiography, based on their
clinical background. The exclusion criteria were patients unwilling
to participate in the study.
For the purpose of multivariate analysis, we included in the study
evaluations of conventional cardiovascular risk factors, such as HTN
(systolic blood pressure ≥ 140 mmHg and/ diastolic blood pressure
≥ 90 mmHg), DM [fasting blood sugar > 126 mg/dl (6.99 mmol/l)
and/glycosylated haemoglobin (HbA
1c
) > 6%], hyperlipidaemia [low-
density lipoprotein (LDL) cholesterol > 120 mg/dl (3.11 mmol/l) and
triglycerides > 150 mg/dl (1.7 mmol/l)], family history of CAD and
cigarette smoking (current smoker: at least five cigarettes/day for
≥ one year).
Statistical analysis
For analysing data, SPSS version 15 (USA, Illinois, Chicago) was
used. The Student’s
t
-test was used for comparing quantitative
variables between two groups and the one-way ANOVA test was
used for comparing means of quantitative variables between
groups. Logistic regression was used for multivariate analysis of
compounding factors. Chi-square and Fisher’s exact tests were
used for analysis of qualitative variables and a p-value ≥ 0.05 was
considered significant.
Results
Of 414 (100%) patients, 250 (60.4%) were male and their
ages ranged from 25 to 84 years. The prevalences of DM, HTN,
hyperlipidaemia, family history of CAD and cigarette smoking were
27.3, 29.5, 39.1, 5.8 and 26.3%, respectively. Basic clinical and
demographic characteristics of the patients are presented in Table 1.
Table 1.
Basic clinical and demographic characteristics of patients
Characteristics
Number (%)
Age, mean ± SD (years)
61.2 ± 27.4
Male gender
250 (60.4)
Diabetes mellitu
113 (27.3)
Hypertension
122 (29.5)
Hyperlipidaemia
162 (39.1)
History of CAD
24 (5.8)
Cigarette smoking
109 (26.3)
History of AP
254 (85.5)
History of MI
85 (20.5)
CAD = coronary artery disease, AP = angina pectoris, MI = myocardial
infarction.
Figure 1.
Diagrams of coronary artery tree demonstrating the 16 segments
counted in the SYNTAX score (A), and six segments counted in the Duke jeopardy
score (B). CFX = left circumflex coronary artery; CFX-MARG = major marginal
branch of the left circumflex coronary artery; LAD = left anterior descending
artery; LAD DIAG = major diagonal branch of the left anterior descending artery;
LCA = left main coronary artery; PDA = posterior descending coronary artery;
RCA = right coronary artery; SEPT = major septal perforating artery. (Adapted
from Sianos,
et al. Euro Intervent
2005;
1
: 219–227, and Callif,
et al. J Am Coll
Cardiol
1985;
5
: 1055.)
B
A