VOLUME 11 NUMBER 2 • JUNE 2014
57
SA JOURNAL OF DIABETES & VASCULAR DISEASE
RESEARCH ARTICLE
observed (Fig. 2). Differences in the epicardial circulation became
apparent between individuals with none or one component of MetS
and those with two or more components (
p
= 0.035). Furthermore,
a linear trend between the number of components of MetS and
impaired coronary microcirculatory responses to adenosine was
observed (Fig. 2). No significant correlation was observed between
the number of MetS components and responses to SNP. Thus,
exposure to increasing number of risk factors of MetS was associated
with greater endothelial dysfunction in both the epicardial coronaries
and coronary microcirculation, and with diminished coronary flow
reserve.
To investigate further the impact of individual components of
the MetS on coronary vascular responses to ACH, we performed
multivariable forward linear regression analysis in which the individual
risk factors for MetS, total number of the components of MetS (0−5),
and the presence of CAD (0/1) were also introduced as covariates.
Beyond age, only the total number of MetS components emerged as
an independent predictor of impaired microvascular response to
ACH (CBF:
β
= −0.18,
p
< 0.001; CVR:
β
= −0.16,
p
= 0.002). Thus, it
is the clustering of the components of MetS rather than any individual
component that best predicts abnormal coronary endothelial function
in the microcirculation. By contrast, presence of CAD was the only
determinant of an abnormal epicardial endothelial response to ACH
(
β
= −0.12,
p
= 0.017) and of microcirculatory response to adenosine
(CBF:
β
= −0.33,
p
< 0.001; CVR:
β
= −0.30,
p
< 0.001).
MetS, coronary vascular function and low-grade
inflammation
Inflammation, estimated as Hs-CRP level, was higher in patients
with MetS (Table 1). By contrast, Hs-CRP level was not associated
with coronary microvascular or epicardial endothelium-dependent
responses to ACH (CBF:
r
= −0.015,
p
= 0.83; CVR:
r
= 0.022,
p
= 0.74; epicardial diameter:
r
= −0.022,
p
= 0.73). In subsequent
analyses where it was included as an additional covariate in the
multiple regression models, Hs-CRP level did not significantly alter
the relationship observed between coronary vascular function and
MetS, number of MetS components, or BMI.
Discussion
We have demonstrated for the first time an independent and
graded relationship between the MetS risk factor burden and
All patients
MetS
No MetS
p
-value
Baseline coronary function
CBF, ml/min
43.9 ± 31.7
45.4 ± 27.9
42.0 ± 36.0
0.29
CVR, mmHg × min/ml
3.59 ± 2.39
3.46 ± 2.37
3.77 ± 2.42
0.20
Coronary artery diameter, mm
2.62 ± 0.73
2.65 ± 0.73
2.57 ± 0.72
0.25
Responses to acetylcholine
Change of CBF, %
108 ± 98
97 ± 93
122 ± 102
0.015
Change of CVR, %
−40 ± 29
-37 ± 31
-45 ± 27
0.008
Change of coronary diameter, %
−0.92 ± 11.01
−1.72 ± 11.32
0.12 ± 10.56
0.10
Responses to nitroprusside
Change of CBF, %
126 ± 85
126 ± 81
125 ± 90
0.95
Change of CVR, %
−52 ± 21
−52 ± 19
−51 ± 23
0.50
Change of coronary diameter, %
17.40 ± 14.07
16.85 ± 14.38
18.16 ± 13.64
0.45
Responses to adenosine
Change of CBF, %
314 ± 157
298 ± 156
335 ± 157
0.03
Change of CVR, %
−72 ± 11
−71 ± 11
−74 ± 10
0.029
BMI: body mass index; CAD: coronary artery disease; CBF: coronary blood flow; CVR: coronary vascular resistance
Categorical variables are presented as absolute (relative) frequencies; continuous variables, as mean ± SD.
p
-values for comparisons between patients with and without MetS are derived from student’s t-test for unpaired measures.
Table 2.
Coronary artery characteristics of the whole study population and according to presence of metabolic syndrome (MetS).
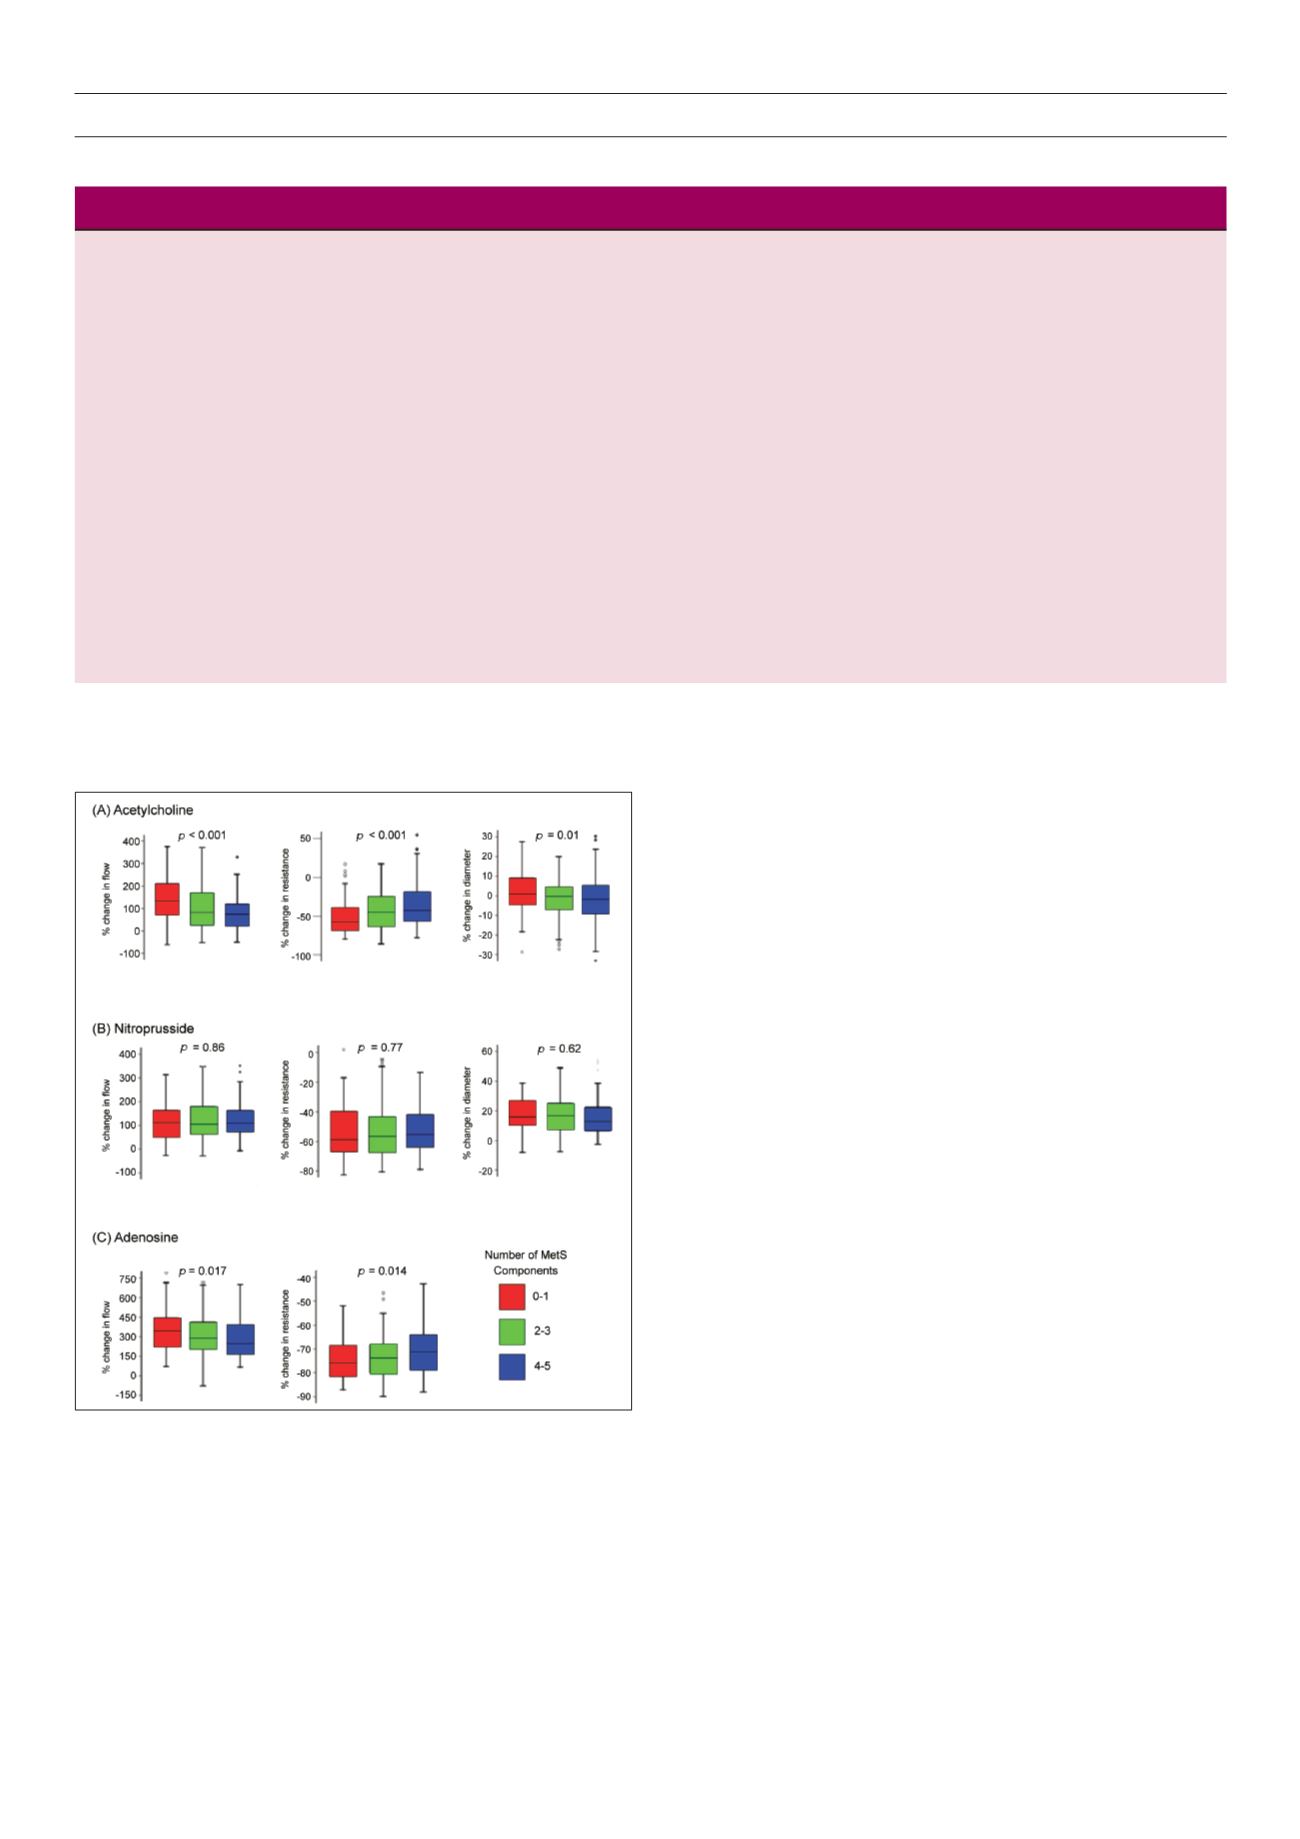
Figure 2.
Coronary vascular function and metabolic syndrome. Percentage
change in coronary blood flow, coronary vascular resistance and coronary epicar-
dial diameter in response to (A) endothelium-dependent vasodilation with acetyl-
choline and (B) endothelium-independent vasodilation with sodium nitroprusside.
(C) Percentage change in coronary blood flow and coronary vascular resistance in
response to adenosine. Subjects with 0/1 component of the MetS in open boxes,
2/3 components of the MetS in speckled boxes and 4/5 components of the MetS
in grey boxes. The centre line of the box denotes the median value; the extremes of
the box, the interquartile range; and the bars, the upper and lower limits of 95%
of the data. Probability values by one-way ANOVA.


