56
VOLUME 11 NUMBER 2 • JUNE 2014
RESEARCH ARTICLE
SA JOURNAL OF DIABETES & VASCULAR DISEASE
distributions before any parametric analyses. Skewed variables are
expressed as a median value (interquartile range). Categorical data
are expressed as absolute frequencies and percentages. Comparisons
between two groups were performed using the student’s
t-test
for unpaired measures (continuous data) and Pearson’s chi-square
test (categorical data). Univariate correlations were performed using
the Pearson’s correlation coefficient. Linear trends between the
number of MetS components and coronary function indices were
evaluated by a one way analysis of variance. Multivariable analysis
adjusting for potential confounders was performed by either analysis
of co-variance (ANCOVA) or forward linear regression analysis. The
assumptions for linearity and homoscedasticity were tested based
on the standardised residuals plots. Exact
p
-values < 0.05 were
considered statistically significant. Data analysis was performed with
SPSS software, version 14.0 (SPSS Inc, Chicago, IL).
Results
Subject characteristics
Of the 418 patients (239 males and 179 females) enrolled, 165
were obese, 163 overweight, and 239 (57.2%) fulfilled the criteria
for MetS. Clinical characteristics of the population according to the
presence of obesity and MetS are shown in Table 1. As expected,
the presence of MetS was associated with a higher frequency and
severity of all of the components of MetS in addition to diabetes.
Overweight/obese patients also had a higher incidence of these risk
factors, except for diabetes. Total and LDL cholesterol levels were
similar in the subgroups. Overall, patients with MetS had a higher
prevalence of CAD.
Individual risk factors and vascular responses
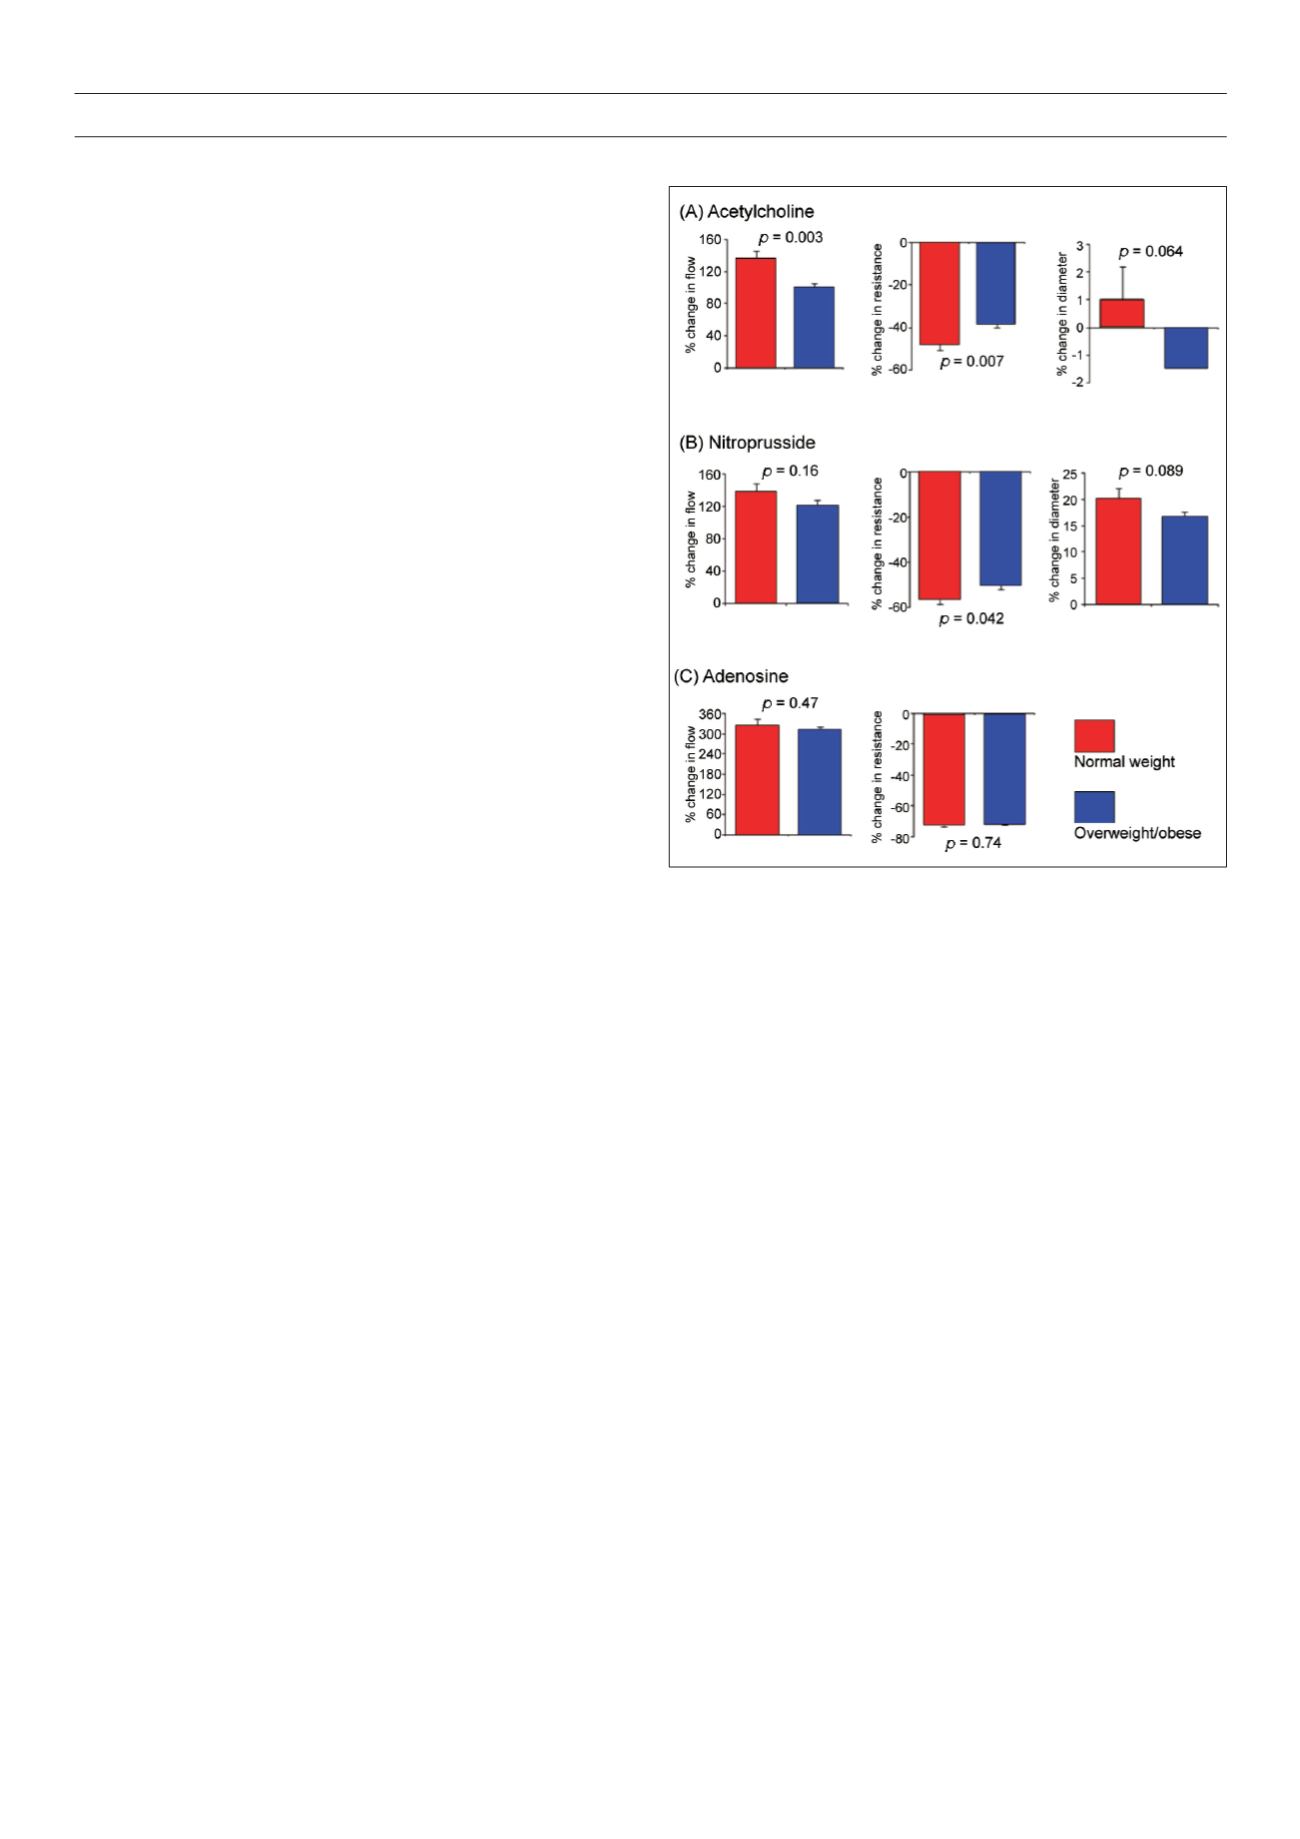
Microvascular responses:
Endothelium-dependent microvascular
vasodilation, measured as the % increase in flow with ACH,
correlated with BMI (
r
= –0.12,
p
= 0.02). The ACH responses were
significantly lower in both overweight and obese compared to
normal weight subjects (100% in overweight/obese vs 135% in
subjects with normal weight,
p
= 0.003) (Fig. 1). Responses to ACH
were similar in the overweight and obese subjects. The percentage
increase in CBF with ACH also correlated with age (
r
= –0.17,
p
=
0.001) and HDL levels (
r
= 0.12, p = 0.021) and was diminished in
those with elevated blood pressure (95% in hypertensives vs 122%
in normotensives,
p
= 0.014), diabetes (70% in diabetics vs 117%
in non-diabetics,
p
= 0.001) and CAD (99% in CAD patients vs
117% in patients without CAD,
p
= 0.02).
Following multivariable adjustment (ANCOVA), overweight/
obesity remained an independent predictor of impaired flow
response to ACH (
p
= 0.049) along with age (
p
= 0.003) and
diabetes (
p
= 0.013). Similar relationships were observed between
abnormal BMI and the change in CVR inresponse to ACH after both
univariable (Fig. 1) and multivariable analysis. Furthermore, if BMI
was considered as a continuous variable in the multivariable model,
it remained a significant predictor of impaired ACH responses (CBF:
standardised
β
= −0.13,
p
= 0.014; CVR:
β
= −0.1,
p
= 0.05).
By contrast, BMI was not correlated with the flow response to the
endothelium-independent vasodilator, SNP, or the flow and resistance
responses to adenosine (Fig. 1). Although overweight/obesity was
related to a lower resistance response to SNP (Fig. 1), this was no
longer significant after adjustment for aforementioned covariates.
Epicardial responses:
Age (
r
= −0.10,
p
= 0.048) and triglyceride
levels (
r
= −0.11,
p
= 0.028) correlated with epicardial responses
to ACH, as was presence of CAD (mean % diameter change of
−2.3% in CAD vs 0.5% in no CAD patients,
p
= 0.002). A trend
towards epicardial vasoconstriction with ACH was observed in
overweight/obese subjects compared to those with normal BMI,
and a weaker trend to impaired vasodilation in response to SNP was
also observed (Fig. 1). Following multivariate adjustment, there was
no independent association between the presence of overweight
or obesity and an impaired dilator response to ACH or SNP (both
p
= NS).
Components of MetS and coronary vascular function
The impact on vascular function of other components of the MetS
in addition to BMI was also studied. Although there were no
significant differences in baseline measurements between subjects
with or without the MetS, microvascular vasodilator responses to
ACH were significantly impaired in subjects with MetS compared
to those without MetS (Table 2). However, the epicardial diameter
changes with ACH and endothelium-independent responses to
SNP were similar in the epicardial vessels and the microvasculature.
Microvascular responses to adenosine were also impaired in patients
with MetS (Table 2).
In the entire population, significant correlations between the
number of MetS components and the response to ACH in both the
coronary microcirculation and the epicardial coronary arteries were
Figure 1:
Coronary vascular function in obesity. Percentage change in coronary
blood flow, coronary vascular resistance and coronary epicardial diameter in
response to (A) endothelium-dependent vasodilation with acetylcholine and (B)
endothelium-independent vasodilation with sodium nitroprusside. (C) Percent-
age change in coronary blood flow and coronary vascular resistance in response
to adenosine. Overweight and obese subjects (BMI ≥ 25 kg/m
2
) in dark columns
and normal weight subjects (BMI < 25 kg/m
2
) in open columns. Results expressed
as mean ± SEM. Probability values by student’s
t-test
.


